


Customer Service AI Agents: 2026 Guide to Boosting KPI & ROI

It is hard not to notice how the conversation around AI agents in customer service is slowly but surely taking over modern-day business talks. Indeed, we are entering the era of zero-touch resolution (ZTR) and agentic workflows – concepts that didn’t exist even three years ago. Yet they now define whether an AI deployment is succeeding or just creating the illusion of progress.
Today, the global AI market size averages $7.6 billion, and it’s projected to reach $47.1 billion by 2030. This is largely consequential, as customer service AI agents have already matured fast enough to handle complex, multi-step interactions. However, the problem most businesses face nowadays is AI-related quality control. The question is how to measure the success of AI deployment, when the majority of existing scorecards don’t include the right KPIs.
With this guide, we aim to uncover not only how AI systems can be useful for businesses in driving success, but also how executives can know whether their AI agents are actually working.
Latest contact center AI news
The contact center landscape has shifted dramatically in the past 18 months:
→ According to a PwC 2025 survey, 79% of organizations now report some level of agentic AI adoption, and 88% plan to expand those investments.
→ Gartner predicts agentic AI will autonomously resolve 80% of common service issues by 2029.
→ And industry research from Calabrio's State of the Contact Center 2025 puts current AI adoption across contact centers at 98%.
Everything points to the fact that the pilot era is over. Now, the main business concern is successful execution. For the full breakdown of what's driving this shift, read our EverHelp contact center AI news.
Why traditional KPIs are failing modern AI agents
Legacy contact center metrics, such as Average Handle Time (AHT), call abandonment rate, and ticket deflection, were designed for a world where every interaction was led by a human. They were never made to evaluate something that can resolve 800 tickets simultaneously without sleeping.
According to research, 64% of contact center leaders say their current KPIs don't accurately measure the customer experience, and only 16% say they have the data they need to truly understand their customers. That gap is where misleading conclusions are born. Teams see the deflection climb, declare the project a success, and miss that customers are coming back.
Because deflection and resolution are not the same thing. A deflected ticket is one that the AI pushed out of the queue. A resolved ticket is one where the customer got what they needed and didn't come back. Legacy metrics blur that line, and in doing so, they inflate success signals while quietly burying the problems underneath.
This is well illustrated by the common pattern from AI deployments:
A team running CX automation sees its deflection rate climb to 70%. Leadership celebrates. Meanwhile, repeat contact rates are rising week over week because the AI is containing issues rather than closing them. Without the right progress tracking, that fact can stay hidden for months, sometimes long enough to cement the wrong conclusions into the strategy.
Clients who bring legacy scorecards into AI projects consistently misread their own results. It's not the issuw of AI underperforming, though. It's just that the existing KPIs don’t really tell anything about how it works. Building performance architecture has to come before automation decisions, and here's what the new standard looks like.
Top 5 core metrics for AI customer service analysis (by industry)
One thing to note: the following metrics are not universal targets to hit. They should be treated more like calibration points, since your benchmarks will continuously shift depending on your vertical, your query mix, and how far into the deployment you are.
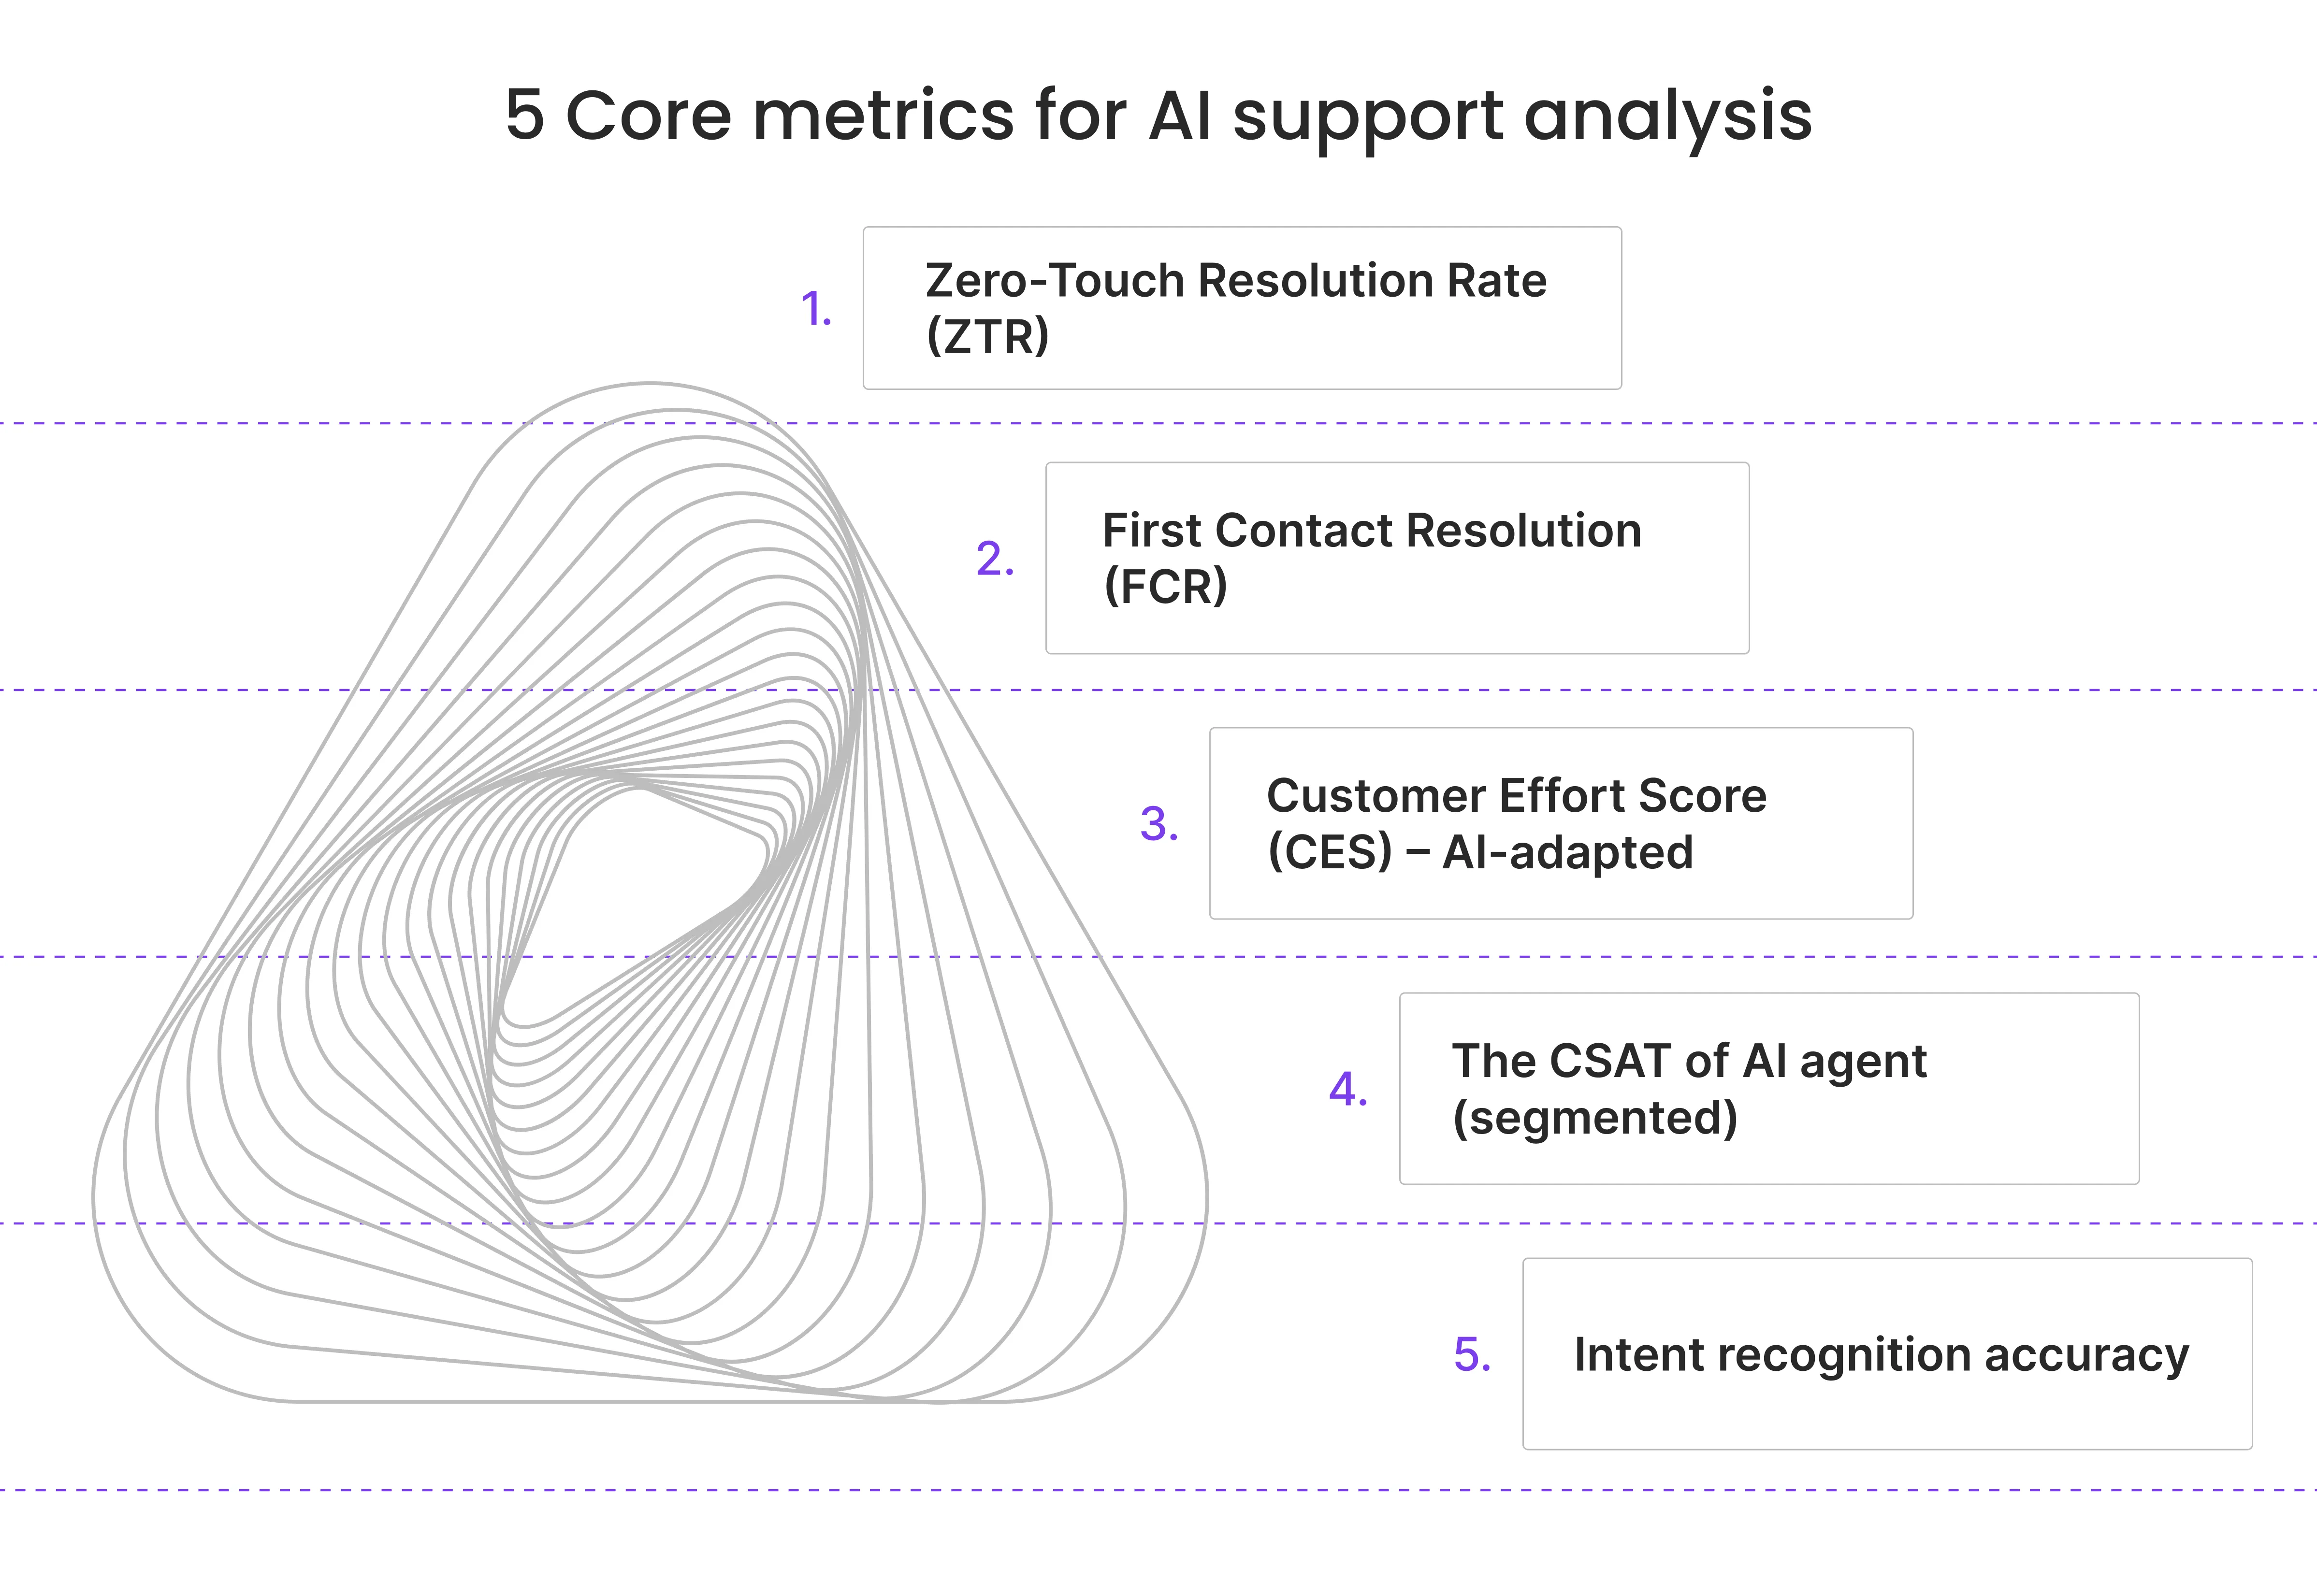
1. Zero-Touch Resolution Rate (ZTR)
ZTR is exactly what it sounds like: the percentage of issues fully resolved by AI, start to finish, with no human touching the ticket. It's the clearest signal of whether you're getting genuine support optimization with AI or just automating the handoff.
Industry targets for in-scope queries generally sit between 60–80%, but vertical matters:
- eCommerce teams handling returns and WISMO queries can realistically hit 70–84% — there's a lot of structured data to work with, and the resolution logic is well-defined.
- Financial services typically target 60–70%, which is appropriate given compliance gates and the complexity of many account-level queries.
Worth knowing: when ZTR is low on queries that should be in scope, the cause is almost never the AI itself. It's usually a knowledge base gap or an intent recognition problem — both fixable upstream.
2. First Contact Resolution (FCR)
FCR has been the north star metric for contact centers for decades. But don’t get it wrong — it hasn't lost that status in the AI era either. If anything, AI raises the ceiling. Top-performing AI deployments can achieve up to 80–85% FCR, compared to 70–75% for traditional centers. That gap compounds over time in both customer satisfaction and cost.
FCR is worth watching also because it signals that the customer reached the right place, got the right answer, and didn't need to follow up. And the combination of low effort and actual problem-solving is what actually builds loyalty.
3. Customer Effort Score (CES) – AI-adapted
Of all the experience metrics, CES has the strongest correlation with long-term brand loyalty: stronger than delight and satisfaction. In an AI context, the relevant adaptation is tracking "Path to Resolution" micro-actions: how many steps did the customer have to take before their issue was closed?
Best-in-class operations target fewer than three micro-actions per resolution. That means no repeating context, no unnecessary re-authentication loops, no dead-end flows that kick the customer back to the start. Every extra step is a friction point, and friction points are what make customers decide whether they'll come back.
4. AI CSAT (segmented)
This is where teams most commonly get it wrong: blending AI and human CSAT scores into a single number. It feels logical, but it hides the signal in both directions. If AI CSAT drops and human CSAT holds steady, you need to know that — and you won't if you're looking at a combined average.
A solid AI CSAT benchmark can be anywhere between 75–84%. As such, anything consistently above 85% is world-class. If your overall CSAT has been drifting downward since the AI rollout and no one has looked at the segmented split, you're possibly optimizing in the dark.
5. Intent recognition accuracy
This is often the last metric teams consider measuring. Yet, if the AI misreads what a customer is asking — routing a billing dispute to a technical queue, flagging a refund request as general feedback — the ripple effect hits every other metric on this list. Poor intent recognition tanks FCR, inflates escalation rates, and decreases CES. And none of it points back to the real cause unless someone's specifically watching intent accuracy.
So what should the benchmarks be?
- 85% is an operational baseline
- 92% is genuinely good
- And if you hit 95%+, one can say you have the strongest production deployments.
We recommend tracking intent accuracy from the first day of your AI launch, as it also allows you to see how the customer service AI agents you’ve implemented are learning and progressing.
Advanced technical metrics worth your attention
The five core metrics above tell you what your AI is doing. The next four we are going to be talking about will tell you how well it's reasoning. It’s these metrics that separate a production-grade deployment from a fancy chatbot with a better UI.
Context Retention Score (CRS)
CRS measures how consistently an AI agent applies contextual facts across interaction turns.
Formula: CRS = Successfully Applied Contextual Facts ÷ Total Required Contextual Facts.
Production-grade agents should maintain a CRS above 0.90 over 50+ turns. A high CRS is a sign that your automated agent feels like a knowledgeable colleague and can provide customers with relevant assistance.
Resolution Durability
Do you know whether the AI-resolved issue stays resolved? Resolution Durability will tell you exactly that as it tracks repeat contact rates at 7 and 30 days post-resolution. It's an increasingly watched metric in leading deployments because high ZTR combined with poor Resolution Durability is a red flag that the AI is containing tickets, not closing them.
Note: Repeat-contact rate should not increase after an AI rollout.
Escalation Accuracy
When you implement agentic AI, you need to know not just how often the AI escalates (25–35% is the healthy target for hybrid models), but whether it escalates at the right moment. Decision trees that trigger on legal risk signals, emotional cues, and complexity thresholds are what this metric measures. According to Bucher + Suter, escalation design is “the hidden failure point” of AI deployments — "the escalation problem is widespread," and poor handoffs are a primary source of CSAT degradation. Having the right escalation triggers, built from live interaction data, is the actual reason why some handoffs feel seamless, while others are giving abandonment.
Knowledge Gap Rate
This metric shows the number of unique unanswered question types per week. It should normally trend downward over time as the knowledge base matures. A flat or rising Knowledge Gap Rate signals either training quality issues or content health problems upstream. Think of it as a weekly health check for the AI's reasoning fuel.
Unlike CSAT or FCR, it's hard to fool: either the AI can answer the question or it can't. That makes it a reliable early warning signal before gaps start showing up in the numbers that leadership actually watches. Before setting your benchmarks, it's also worth understanding the full tradeoffs and benefits of AI in customer service. The wins are real, but so are the failures, and you need to know which ones you may face.
{{cta}}
Human-AI collaboration metrics to track for success
Most companies have already moved away from the question of whether to use AI. Now, most businesses are wondering how to successfully combine it with the existing human-agent-led infrastructure. 85% of organizations deploy a combination of human and AI agents, and 64% of CX leaders plan to increase investment in AI and related technologies, so the only question is how well they can organize the handoff.
There are three metrics that you can use to judge whether your human+AI collaboration is working:
- AI Assist Adoption Rate → the percentage of agent interactions where AI suggestions were actually used. Though low adoption is oftentimes a UX or trust problem, it’s always worth checking whether there’s a suggestion quality problem.
- Escalation Satisfaction Score → CSAT tracked specifically after a handoff from AI to human. A drop here indicates that the handoff moment itself is damaging the experience.
- Agent Cognitive Load Indicators → track whether AI assistance is actually making your agents' jobs more manageable. Watch for response-time variance (are agents slowing down under high AI-assist volume?), rising error rates, and handle-time increase.
What those three metrics have in common is that they all measure the boundary between AI and human work. When establishing an AI-assisted system, it’s important to establish:
- What the AI is responsible for
- What is the human agents’ scope?
- When should the AI transfer the situation to a human?
That’s what our human+AI support model is built on at EverHelp. Because the outcomes of that decision will influence your metrics (FCR, CSAT, Retention Rate, etc.). Technology matters but so does process organization.
Beyond the survey: real-time sentiment & CX metrics
Traditional CSAT surveys capture a post-interaction snapshot of one thing: how annoyed or satisfied a customer felt when they filled it out. AI now allows for a real-time sentiment analysis across all interactions. In the traditional approach, such a sampling rate was just 5%.
If you decide to get into sentiment analysis, pay extra attention to the following metrics:
→ Sentiment Trajectory – how a customer's tone shifts across the interaction.
→ Emotional Escalation Triggers – real-time signals that a customer is moving toward a churn-risk state.
→ Goal Completion Rate (GCR) – whether the customer actually accomplishes what they came to do; worth tracking separately from CSAT.
The bigger opportunity, though, is proactive intervention — catching problems before a ticket gets raised at all. McKinsey's research on AI-powered proactive CX models puts the impact at 15–20% CSAT improvement and 20–30% reduction in cost-to-serve, specifically for organizations with integrated, AI-driven engagement across the full customer lifecycle.
Example: Verizon CEO Hans Vestberg stated in 2024 that the company's generative AI deployment — covering 170 million annual calls — could predict the reason for a call 80% of the time, and was on track to retain 100,000 customers as a result.
The financial impact: measuring AI agent ROI
Let’s first get the core math straight:
Monthly savings = AI resolution volume × (human cost per contact – AI cost per contact)
Now, to the basic fees:
- Human-handled tickets run from $8–$13.50 on the low end to $20-$30 on the high.
- AI resolutions cost $0.99–$3.00.
Having established that, you can now calculate ROI for your business. After analyzing available online data, we have found the following information in terms of AI-related business ROI:
Important context: these are for successful deployments only. Only ~5% of companies achieve substantial AI ROI, and 35% report partial returns. The majority see no measurable P&L impact within the first 18 months. The ROI curve is real, but it applies to the minority that gets implementation right.
Additionally, the total cost of the AI agent pricing model for a specific business depends largely on the solution you choose, but also on the typical volume of repetitive queries and the type of tickets needed to be processed.
Yet it’s hard to deny that AI improves overall business performance. It facilitates customer retention since they provide quick assistance right when customers need it. And, according to industry findings, consumers are 2.4 times more likely to stay loyal when their issue is resolved quickly, which means fast resolution is also a revenue-protective factor for the company.
Comparison: legacy chatbots vs. 2026 AI agents
For the longest time, legacy chatbots were everything a business would want, as they kept simple, high-volume tickets away from human agents. However, most organizations have much more versatile needs now. Customer queries are more complex, expectations are higher, and the operational bar has moved. As a result, 72% of enterprises are either in production with or actively piloting agentic AI.
But what’s the difference between the two?
Legacy chatbots vs. 2026 AI agents
Case study: how EverHelp redefines metric standards with Evly AI
Our AI customer service agent, Evly, launched in May 2025 and has already been a part of 43 deployment cycles, mostly across eCommerce and SaaS projects. Along the way, we learned a lot about measuring the success of the AI product.
The headline metrics:
- Ticket classification & routing accuracy → Evly has now rereaches 94%-95%
- Fully automated resolution rate → we’ve accomplished 80% on most projects
- Response accuracy → Evly provides accurate responses in 90% of interactions.
- First response time → averages 15-30 seconds with Evly.
So when we first started introducing Evly to our clients, we also introduced modified scorecards to include metrics to track classification and escalation accuracy, ZTR, resolution time, and durability. All of these KPIs have helped us track Evly’s performance and calibrate its ongoing training accordingly. Without that, we wouldn’t have achieved what we have now.
If you are interested to learn mopre about our AI deployments, check out our AI in Customer Service Handbook for more details and case descriptions.
The EverHelp lessons — 4 pillars of high-performing AI agent strategy
Through our experience with implementing Evly, we have gained a lot of practical knowledge, especially on what makes the AI agent launch successful. Here are our key lessons:
- Instrument before you automate.
Connect your touchpoints and set up the analytics before the AI goes live. You can't fix issues if you won’t see them, and flying blind in the first few months is an expensive way to learn that. - Define "resolved" before you launch.
The AI will do exactly what you tell it to do. If you haven't defined what a successful resolution looks like (with escalation triggers and compliance guardrails), you won’t see meaningful automation. - Separate your knowledge sources.
Keep an AI-specific knowledge base that only contains what customers should see and what your AI could use. Mixing internal documentation into the same pool is the fastest route to hallucinations and data security risks in production. - Outline both the role of AI and human agents.
If the AI handles routine and repetitive queries, agents can be focused on more complex cases. What are those cases? What is the algorithm for the agents working with AI-routed tickets? You need to answer those questions to be able to organize your workflows effectively.
Measure right, and the ROI follows
The organizations seeing the strongest returns from AI agents in customer service mostly share two habits: they fixed their measurement framework and pre-organized the work framework.
Get those right, and your ROI case will just write itself. Ready to see what AI can do in practice? Book a meeting, and we will discuss the agentic AI options for your specific business needs.
FAQ
It depends on where you are in the deployment and what query types are in scope. On day one, 30–40% is realistic. Within 6–12 months of ongoing optimization, the industry average is 60–70%. The best-performing implementations — particularly in eCommerce handling returns and WISMO — consistently hit 70–85%.
Benchmarks shift significantly by vertical, so comparing across industries isn't always useful. Here's a more practical breakdown:
- eCommerce: ZTR 70–84%, FCR 82–88%, payback period 6–12 months
- Financial services: ZTR 60–70%, FCR 78–84%, payback period 8–14 months
- SaaS/tech: ZTR 65–80%, FCR 80–86%, payback period 4–10 months
To achieve best-in-class results in any of these verticals, watch out for the quality of the knowledge base and how well intent recognition has been tuned.
There's no single standardized method yet, but three proxies have been shown to work well in practice:
- Knowledge Gap Rate → tracks unique unanswered question types per week. When this is high or flat, the AI encounters queries it hasn't been trained on and improvises.
- Post-resolution audit sampling → a structured QA process that reviews a percentage of AI-resolved tickets weekly, scoring factual accuracy and source alignment.
- Escalation flags → when a confident AI response later triggers a complaint or escalation, the original interaction gets flagged for hallucination review.
It's better to aim for prevention rather than issue detection. The most reliable safeguard is to keep a clean, AI-specific knowledge base with strict source separation, so the model reasons only from verified, customer-relevant content.
Yes. In fact, AI-enhanced deployments regularly achieve 80–85% FCR compared to 70–75% for traditional centers. The gains come from a few specific areas: faster and more consistent intent recognition, 24/7 availability that eliminates the FCR penalty from after-hours queuing, and access to a complete knowledge base without the variability that individual human agents introduce.
Full onboarding takes 28 days. SLA metrics targets, escalation workflows, and priority tier definitions are locked in during Week 1 and go live with the team launch in Week 4. For companies that need to move faster, the timeline can be compressed. Reach out to get a personalized quote and timeframes for your own rapid support launch!
We guarantee your AI support will be live within 14 days of project kickoff. In those 14 days, we cover everything needed for a production-ready launch: knowledge base creation, AI training, integration setup, escalation mapping, and full QA sign-off. Most vendors get delayed by poor preparation — unstructured content, vague escalation rules, and missing resolution criteria. We solve all of that upfront. And after the launch, we continue to track all processes and metrics to continuously improve your resolution rates and overall support quality.
Start with this formula:
Monthly savings = AI resolution volume × (human cost per contact – AI cost per contact).
Beyond that, factor in:
- Revenue protection → faster resolution reduces churn.
- Operational scale → AI handles volume spikes without headcount changes, which has its own financial value during peak periods.
- Operational costs → it's important to consider how much you are spending to continuously maintain an effective AI system.


Help someone else stay in the know. Hit that share button!


.png)

.webp)


.webp)

.jpg)


%20(1).png)


.webp)
.webp)
%20(1)%20(1)%20(1).webp)

.webp)
%20Rate%20Smartly.webp)

.webp)


.webp)


.webp)
.webp)

.webp)