


Customer Lifetime Value Guide: Formula & Free Calculator

Customer lifetime value (CLV) is the total revenue a business can expect from a single customer over the course of their relationship, meaning every dollar they contribute throughout their loyalty lifecycle.
Most businesses track it. Fewer build a strategy around it. And fewer still realize that their biggest CLV lever isn't pricing or acquisition – it's what happens after the sale. Current research shows that 59% of customers will abandon a brand after a single poor experience, and 93% are more likely to make repeat purchases from companies that offer excellent customer service. As such, the key to higher CLV is clear. But before we name it, let’s dig into more detail, shall we?
In this guide, we will walk you through the CLV formula, how to calculate the lifetime value of a customer for SaaS and ecommerce, which KPIs predict it, and why customer support is the most underrated growth driver in your business.
What is customer lifetime value (CLV)?
CLV (also written as CLTV or LTV) measures the total net profit a business earns from a customer across the entire relationship, shifting the lens from individual transactions to long-term revenue streams.
Two versions exist in practice:
- Historic CLV → calculates value based on past purchases, useful for segmenting your existing base and identifying top-value cohorts.
- Predictive CLV → uses behavioral data and modeling to estimate future value, and so is better suited to proactive retention decisions and acquisition planning.
CLV is inseparable from Customer Acquisition Cost (CAC). It directly informs:
- How much can you justify spending to win a customer
- Which retention programs to fund
- Which audience segments to prioritize?
The widely accepted benchmark is a CLV: CAC ratio of 3:1 – for every $1 of acquisition spend, there should be a $3 ROI in lifetime value. For context on why this math matters: the probability of selling to an existing customer is 60–70%, compared to just 5–20% for a new prospect. Companies falling below a 3:1 ratio typically either overspend on acquisitions or fail to retain customers long enough to recoup the investment.
How to calculate customer lifetime value + formula
The math is easier than you probably expect. You need just three core inputs to produce a working CLV estimate + a gross margin to make it more precise.
The standard formula:
CLV = Average Purchase Value × Purchase Frequency × Customer Lifespan
For a margin-adjusted result (recommended for most businesses):
CLV = Average Purchase Value × Purchase Frequency × Customer Lifespan × Gross Margin
Quick example:
A subscription business charges $50/month. The average customer stays 24 months. Gross margin is 70%. CLV = $50 × 12 × 2 × 0.70 = $840
There's also the Net CLV variant, which deducts Customer Acquisition Cost for a truer view of profitability per relationship:
Net CLV = CLV – CAC
You can use the free CLV calculator below to run these numbers for your own business in under a minute.
How to calculate customer lifetime value – SaaS
For SaaS, the formula needs to be churn-adjusted to better reflect subscription dynamics:
CLV = (ARPA × Gross Margin) ÷ Churn Rate
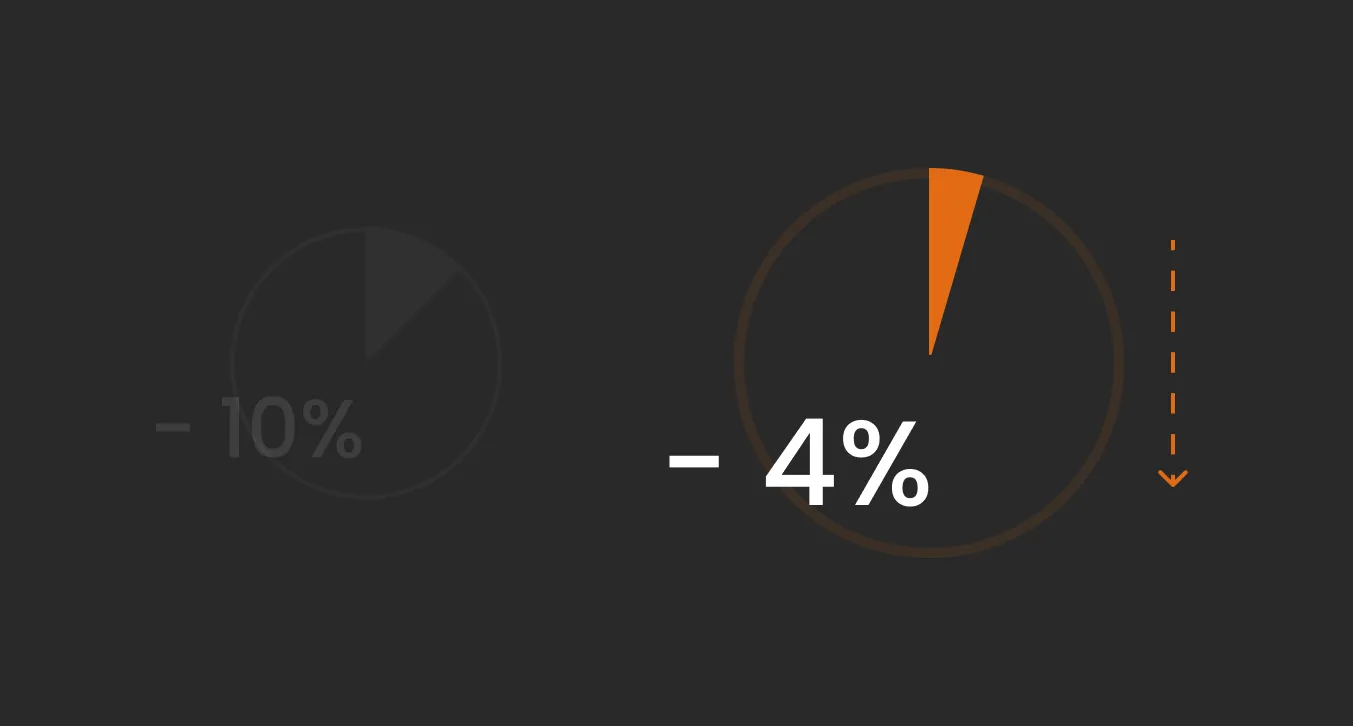
ARPA (Average Revenue Per Account) is your MRR divided by active account count. Monthly churn is the critical variable – cutting it from 5% to even just 4% materially extends average customer lifespan and compounds into significant CLV growth. The healthy SaaS benchmark is a CLV: CAC ratio of 3.0x–3.5x, a range associated with stronger net revenue retention and better valuation multiples.
Pro tip: If you're working to reduce churn, you can also plug your churn rate into the formula to see exactly how much more lifetime revenue you can unlock when bringing down the percentage of churned customers.
How to calculate customer lifetime value – e-commerce
E-commerce CLV depends on three key metrics:
- AOV (Average Order Value)
- Purchase frequency
- And the average customer lifespan.
Example: $50 AOV × 2.5 purchases per year × 3-year lifespan = $375 CLV
Platforms like Shopify and BigCommerce natively surface most of this data. You can usually see purchase history, order frequency, and AOV in your analytics dashboard. The bigger challenge in eCommerce is extending lifespan. Especially now, as customers often buy once and disappear. The digital CX you deliver post-purchase often determines whether they return.
Which metrics predict customer lifetime value?
Primarily, there are six KPIs that predict CLV more than any others. Knowing which ones are underperforming in your business is the first step toward increasing your revenue and driving LTV higher.
CLV-predictive KPIs and their business impact
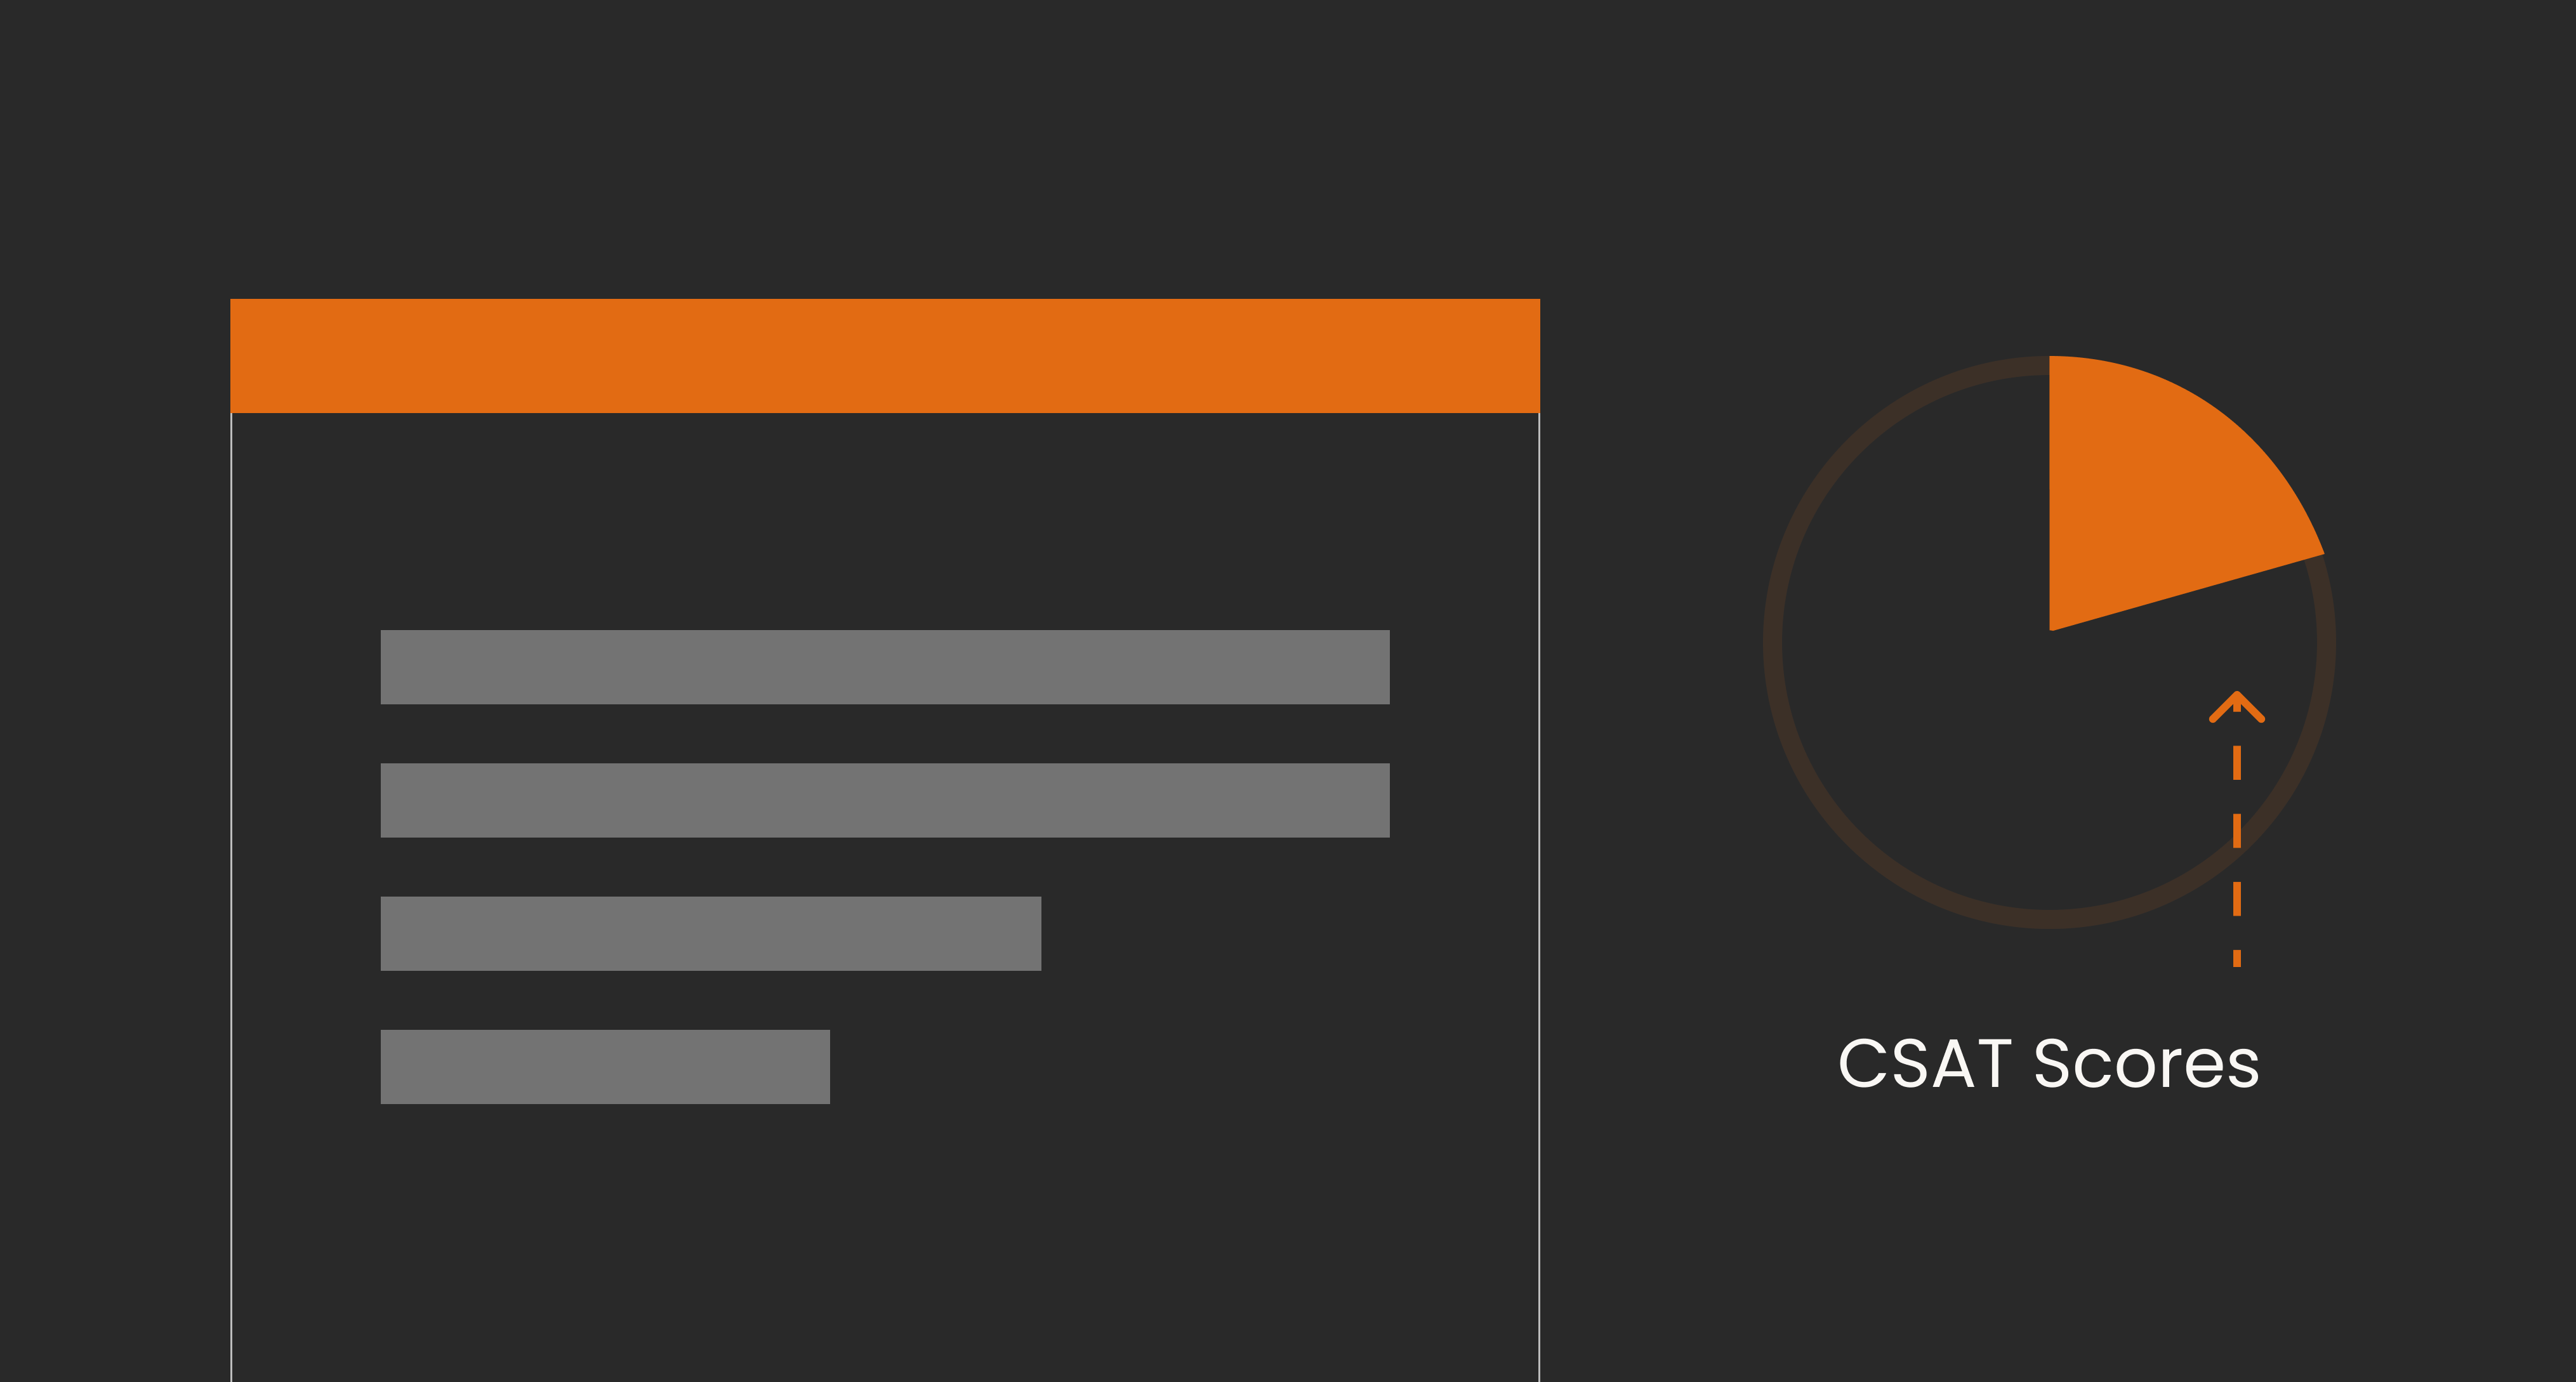
The first four metrics are things most finance and marketing teams already track. The last two (NPS and Time to Resolution) are core VoC signals that basically tell you whether your support team is a revenue driver or just a cost center. If your resolution times are climbing and your NPS is flat, your CLV is quietly eroding, even if your customer acquisition numbers look fine. And that's why it’s important to pay extra attention to support-related metrics as well.
{{cta}}
How to increase customer lifetime value: Quick guide
If you think about what triggers CLV growth, by now you should be able to distinguish 4 levers:
- Retention
- Purchase frequency
- Average order value
- And rgoss margin.
Retention – the foundation
By this time, everybody knows that acquiring a new customer costs 5–25 times more than retaining one. That’s why the heavy investment in customer loyalty programs, proactive onboarding, and personalized communication to keep customers engaged between purchases is not only justifiable but very much needed for improving retention and driving LTV.
Purchase frequency – keep them coming back
Triggered email flows, re-engagement campaigns, and loyalty rewards all encourage repeat buying. Moreover, 66% of consumers have made a purchase online as a direct result of an email marketing message. Having a re-engagement mechanism is important to keep the customers alert and aware of your brand. And it doesn't have to be complex either – it just needs to be consistent and well-timed.
AOV – upsell and cross-sell intelligently
Support agents trained to recommend complementary products or upgrades can directly lift AOV. To be more precise, cross-selling increases AOV by approximately 10–15%, specifically, while identifying the right cross-sell product can boost conversion rates by up to 60%. And this is all without any additional acquisition spend. So, having a support team that knows what to offer, when, and to which clients, is just another way for your business to see that LTV growth.
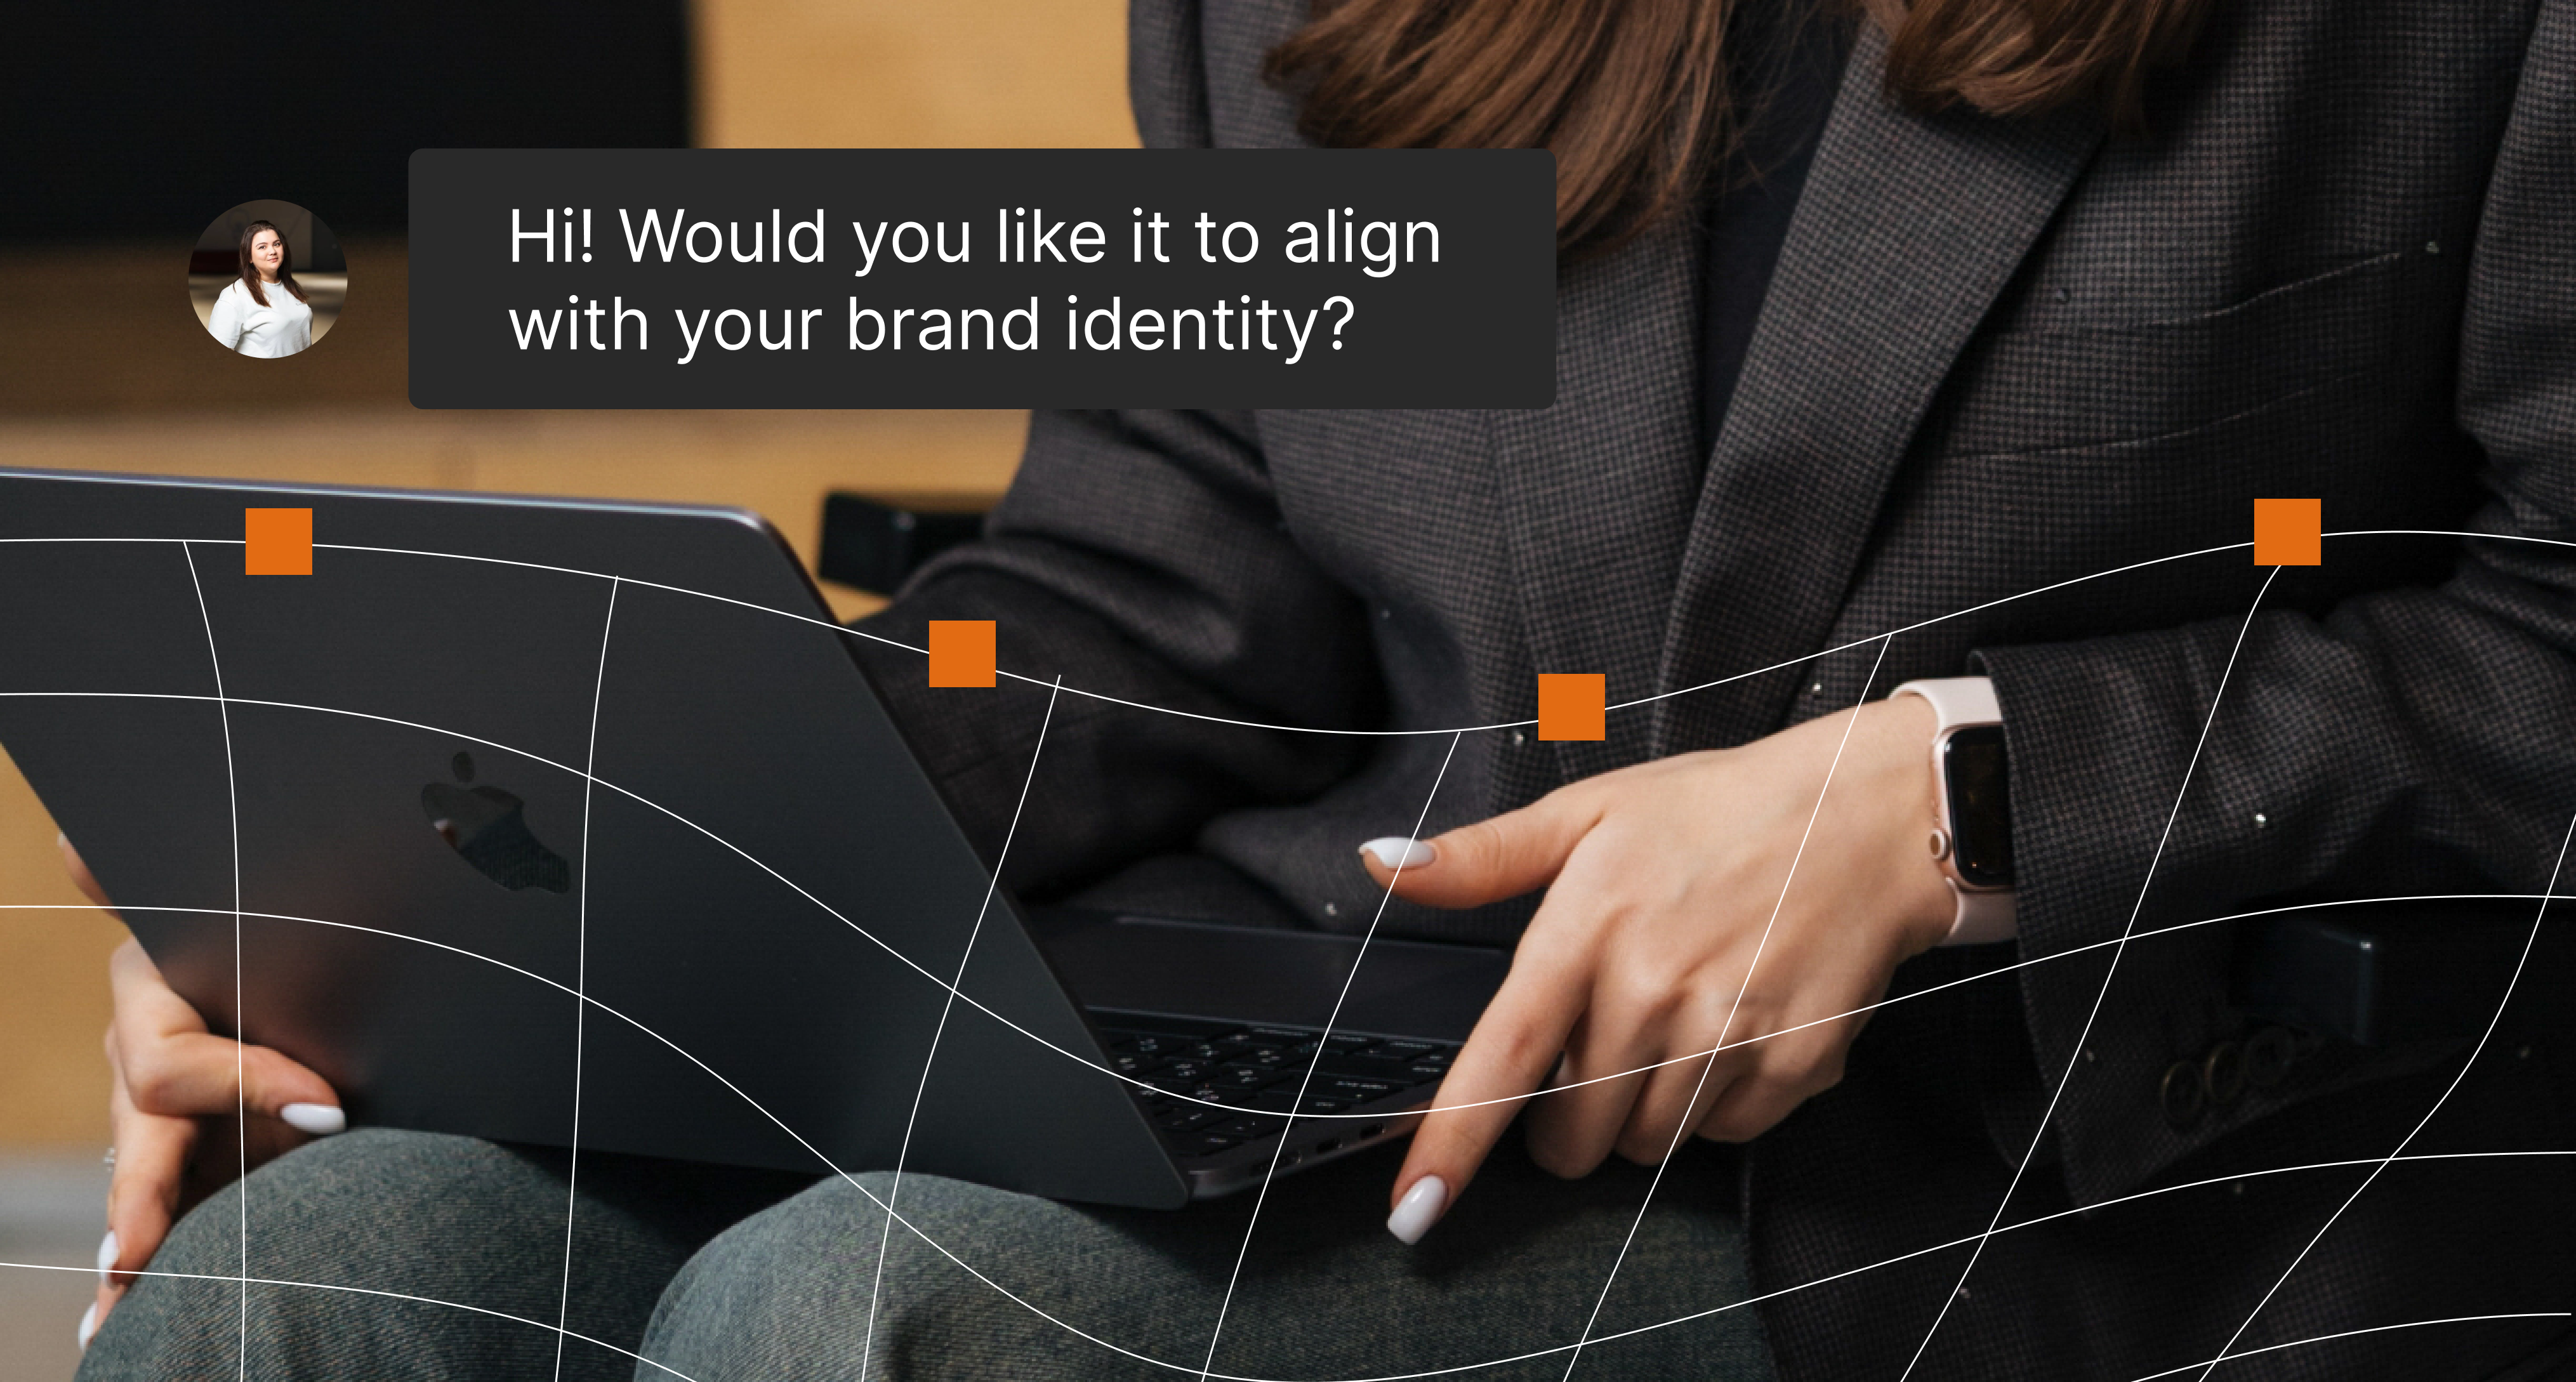
Personalization – make every interaction relevant.
In 2026, personalized customer service is no longer optional. Considering 71% of consumers expect personalized interactions from companies, and 76% say they get frustrated when they don't receive them, it’s unsurprising that this support trend has now become a major predictor of CLV. Providing a more personalized service throughout the whole customer experience is a direct way to increase customer satisfaction and, with it, the number of purchases your customers make with you.
How to track customer lifetime value
We have established which metrics can predict LTV and which are needed to calculate it. But what about tracking? How do you keep tags on all the variables to measure your customer lifetime value?
Reliable CLV tracking requires the combination of three data inputs:
- transactional data (purchase amounts, dates, frequency)
- behavioral data (site interactions, email engagement, product usage)
- demographic data (acquisition channel, segment, customer profile).
Most businesses have all of this and just need to connect them. Luckily, as we live in the digital age, you have quite a choice of tools that can help you keep all the tags in one place.
CLV tracking tools by category
Data analytics platforms are worth adding to this stack, as they close the gap between transactional records and behavioral signals. Because most CRMs track purchases, not frustration. Add a customer service analytics tool, and you can start seeing an actual picture, with patterns your sales data would never show you.
How to analyze customer lifetime value
We know what goes into the lifetime value of a customer, but how do we analyze that data to then make sound business decisions?
Step 1. Segmentation
Start by segmenting your customer base by total revenue generated per account over their entire relationship with you. Most businesses operate by the 20/80 rule here — a small cohort of customers driving the majority of revenue. That top segment is your baseline, so study their:
- purchase behavior
- acquisition channel
- onboarding path
- and support history.
Whatever they have in common is what you want to replicate.
Pro tip: Look for those customers who’ve spent consistently. A customer with 12 small purchases over two years is often more valuable (and more replicable) than one who made a single large order and never returned. Sort by purchase frequency alongside total revenue to get a cleaner picture of your truly loyal segment.
Step 2. Cohort Analysis
From there, run a cohort analysis. Group customers by the month or quarter they were acquired, then track how much each cohort has spent over 3, 6, 12, and 24 months. This tells you two things:
- Which acquisition periods produced your highest-value customers (and therefore which channels or campaigns were responsible)
- And at what point in the customer lifecycle does revenue typically drop off or accelerate?
If one cohort consistently outperforms others, dig into what was different about the acquisition or onboarding of those customers.
Pro tip: Pay close attention to the 30–90 day window after acquisition. That's when you can either win or lose most long-term retention. If a cohort shows a sharp revenue drop in that period, the problem usually is in the onboarding experience. A single proactive check-in or a well-timed support touchpoint in that window can meaningfully change how the rest of the customer lifecycle plays out.
Step 3. Churn signals analysis
Your next step is looking at churn signals. Pay attention to customers who left in the past 12 months and work backward: what did their behavior look like in the 60–90 days before they churned? Declining purchase frequency, unresolved support tickets, low NPS scores, and customer feedback trends are the most common early indicators. Once you know your churn pattern, you can build an at-risk flag into your CRM and intervene before the customer walks.
Pro tip: Build your at-risk flag around behavior. A drop in login frequency, a support ticket that went unresolved for more than 48 hours, or a missed renewal prompt are often stronger predictors of churn than a low NPS score. If your CRM allows custom triggers, set an alert for any account that goes 21+ days without an interaction — that silence is usually the earliest warning sign you'll get.
Step 4. Reporting
Finally, set a reporting frequency that matches the times when each team actually uses the data:
- Operational teams need weekly or even daily visibility into resolution times and ticket volumes.
- Marketing needs monthly cohort performance to evaluate campaign quality.
- Leadership needs a quarterly CLV trend to determine whether the average lifetime value is rising or falling, and why.
Pro tip: Whenever you present CLV data to leadership, pair the trend line with a single causal explanation to show why the CLV changed. Did a new onboarding flow improve 90-day retention? Did a spike in unresolved tickets correlate with a churn uptick the following month? The teams that get the most out of it are the ones that can treat each reporting cycle as a hypothesis that will either be supported or disproved.
Why customer service is your secret CLV multiplier
Most growth-stage companies follow a similar pattern. They invest heavily in acquisition (e.g., ads, sales, outbound) and then underinvest in everything that happens after the sale. It's not a bad strategy per se, but it creates a slow leak: customers come in one end and slip out the other, and CLV never climbs the way it could have.
44% of businesses allocate more budget to acquiring new customers than to retaining existing ones. And this is despite data showing that retained customers spend more, buy more often, and refer others. That misalignment directly suppresses CLV because the relationship-building side of the business is starved of resources.
Customer service, as such, is basically the connective tissue between every CLV lever. It drives retention, enables upselling, fuels NPS-based referrals, and reduces time-to-resolution – all four metrics we've identified as CLV-predictive. The numbers are fairly unambiguous:
- 70% of customers say they would stop buying from a company after just two bad experiences.
- 55% have already backed out of a purchase due to poor service.
- 75% of shoppers are more likely to be loyal to the brand that understands them on a more personal level.
Run those numbers back through the CLV formula, and you’ll see that lower churn means longer customer lifespan, longer lifespan means higher lifetime value. The formula is the same. What changes is whether your support operation is helping your business or working against it.
Scaling your support with EverHelp
There's a point most growing businesses hit where the support team simply can't keep up. Tickets stack, response times stretch, and the customers who notice and care enough to leave are usually the ones who'd been with you the longest.
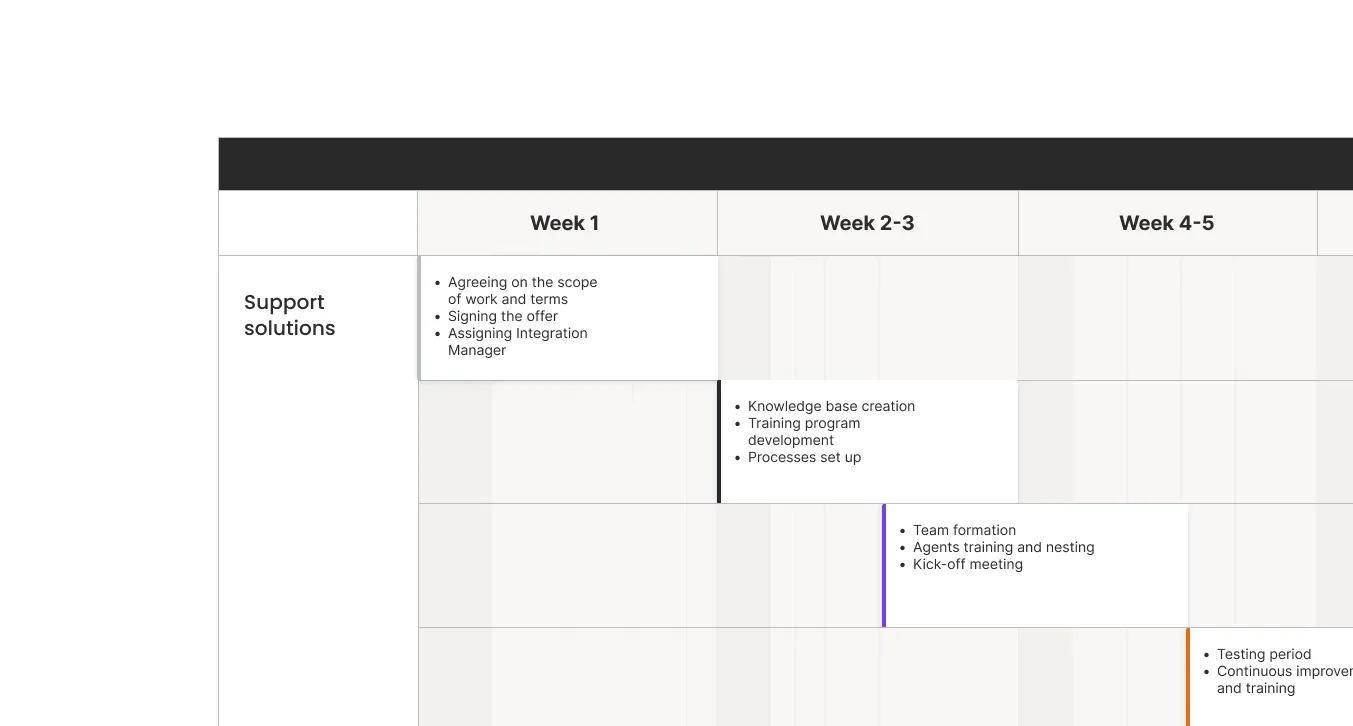
That's where we come in as your customer support outsourcing partner. At EverHelp, we handle the support functions that have the most direct impact on CLV:
- response speed
- first-contact resolution
- personalized customer service
- and around-the-clock support
We do it at scale, so your internal team doesn't have to choose between keeping up with tickets and focusing on the product.
For ecommerce brands and SaaS companies where a strong customer retention strategy is central to the model, keeping the focus on product and growth in-house, while delegating customer relationships to good hands, is a structural advantage.
If you're serious about CLV, the question isn't whether support quality affects it — it clearly does. The real question is whether your current setup can hold that quality as the volume grows.
{{cta}}
FAQ
There's no single universal benchmark, as a healthy CLV depends heavily on industry, margins, and acquisition costs. The most useful frame is the CLV:CAC ratio:
- 3:1 is the general baseline across most business models.
- For SaaS, the target range is 3.0x–3.5x; below 3.0x typically signals either excessive acquisition spend or a churn problem.
For ecommerce, focus tends to center on extending average customer lifespan and raising AOV, both of which usually compound into materially higher CLV over a 2–3 year window.
Directly, as service quality affects three of the four CLV formula inputs:
- it reduces churn (longer customer lifespan)
- enables upselling (higher average purchase value)
- and drives NPS-based referrals that lower effective CAC.
As such, every support interaction can be said to either add to or subtract from the customer lifespan variable in your CLV formula.
In practice, CLV (Customer Lifetime Value), LTV (Lifetime Value), and CLTV all refer to the same metric. Some specialists use LTV when referring to value aggregated across customer segments rather than individual accounts, but there's no formal industry distinction between the terms. The lifetime value of a customer means the same thing regardless of the acronym – use whichever you like.
Yes. But you can also estimate average customer lifespan directly from your churn rate:
Average Customer Lifespan = 1 ÷ Monthly Churn Rate.
A 5% monthly churn rate implies an average lifespan of 20 months. This approach is standard in SaaS, where the churn-adjusted formula (CLV = ARPA × Gross Margin ÷ Churn Rate) can be used to avoid defining lifespan explicitly.
CLV comes down to how long customers stay and how much they spend while they're with you. Both of those things are directly shaped by the support experience. At EverHelp, we work with ecommerce brands and SaaS companies to make sure that experience doesn't become the weak link. Our teams work to improve response speed, resolution quality, facilitate personalization, and allow for 24/7 coverage so customers feel looked after at every stage of the relationship. Less churn, more repeat purchases, higher lifetime value. That's the outcome our clients seek, and we deliver.


Help someone else stay in the know. Hit that share button!


.webp)


.webp)


.png)


.webp)

%20(1)%20(1).png)
%20(1).webp)
%20(1).png)

.png)


.webp)

.webp)
.webp)
%20Rate%20Smartly.webp)
.webp)
.webp)

.webp)


.webp)


_%20Strategies%2C%20Tools%20%26%20A%20Client%20Success%20Story%20(3).webp)
.webp)
.webp)
.webp)
.webp)

.webp)