


Customer Service Metrics To Make Better Decisions, Not Just Charts

TL;DR: Most teams track dozens of customer service metrics but can't turn data into action. This guide reveals which metrics drive decisions – CSAT, FCR, Quality Score, FRT, CES – and how to move from spreadsheets to real-time dashboards. Focus on 3–7 decision-ready KPIs, balance speed with quality, and build feedback loops that connect metrics to staffing, training, and process fixes. We’ll show you how.
A survey of 300 enterprise organizations found that 42% struggle to extract insights from their data, despite measuring everything. The problem isn't a lack of metrics in customer service – it's that teams treat them as reporting exercises, not decision-making tools. They create charts for meetings, then go back to firefighting without changing how agents work or how customers feel.
Professional 24/7 operations, like EverHelp, think differently. They use a customer service metrics dashboard to monitor their 96% Quality Score and <45-second response times in real time. When performance dips, they act immediately – before customers notice.
This article shows which metrics drive better decisions and how to visualize success so the next right action is obvious.
What Are Customer Service Metrics, Really?
They're quantifiable indicators of quality, speed, effort, and business impact – not just activity counts or vanity numbers.
Defining Metrics in Customer Service in Business Terms
Customer service metrics are quantifiable indicators that reveal whether your support operation is delivering on the promises that matter to customers and the business. They measure service quality, speed, effort, and impact – not just "call center stats" or activity counts.
The distinction matters. Raw ticket volume tells you how busy your team is. First contact resolution tells you whether customers are actually getting help. One is a vanity metric. The other drives decisions about training, routing, and knowledge base investment.
Effective metrics for customer service answer strategic questions:
- Are we solving problems on the first try, or sending customers on a runaround?
- Do customers find it easy or exhausting to get help?
- Are we earning loyalty, or just checking boxes?
When metrics connect to outcomes like retention, repeat purchase, and customer loyalty, they stop being numbers in a dashboard and start being levers you can pull to improve the experience and the business at the same time.
Why Traditional Metrics Don’t Tell the Whole Story
Isolated numbers hide context. A team that closed 5,000 tickets last month sounds productive until you learn that 40% were reopened because issues weren't actually resolved. A 90-second average handle time (AHT) looks efficient until you discover customers are calling back twice because agents rush them off the phone.
Spreadsheets amplify these blind spots:
- When metrics in customer service live in static reports, you can't see patterns across channels, customer segments, or intent.
- You can't tell if your chat team is struggling with a specific product issue.
- You miss that email response times spike every Monday because of weekend backlog.
Focusing only on speed creates perverse incentives. Average handle time and first response time are easy to measure, which is why so many teams over-index on them. But when agents optimize for speed alone, they skip steps that build trust, miss chances to educate customers, and create repeat contacts that cost more in the long run. Speed without quality doesn't reduce cost – it just moves it downstream into customer churn and negative reviews and word-of-mouth.
The best customer service performance metrics are never viewed in isolation. They're read in combination: response time and CSAT, resolution rate and reopens, efficiency, and effort. That's how you distinguish good fast from bad fast.
Why Customer Service Metrics Matter More Than Ever
Because modern teams use metrics to answer “Are we earning loyalty?” not “How many tickets did we close?”
1. From Reporting Overhead to Strategic Asset
Modern service teams don’t measure success by how many tickets they touch. They ask:
“Are we making customers happier and more loyal?”
The shift from activity-based to outcome-based measurement is what separates support teams that cost money from those that protect and grow revenue.
When you use metrics for customer service strategically, they tell you which workflows are broken, which agents need coaching, and which product issues are creating avoidable contact. They reveal whether your self-service content is working or wasting time. They show you if a channel is over-staffed or under-resourced before customers start complaining about wait times.
The connection to revenue is direct. Research shows that customers who have effortless experiences are more likely to repurchase and recommend. When you track customer service metrics like Customer Effort Score alongside satisfaction and first contact resolution, you’re not measuring support performance – you’re measuring the health of customer relationships that drive retention, repeat purchase, and lifetime value.
2. The Risk of Chasing the Wrong Numbers
Common failure modes appear as follows: a team optimizes the ticket closure rate and inadvertently trains agents to close issues prematurely, resulting in a spike in reopens. Another focuses on speed and sacrifices quality, driving CSAT down and creating negative reviews. A third tracks only volume and misses that 70% of contacts are about the same confusing checkout flow. As a result, your customers get poor customer service.
Customer service metrics that matter are the ones you can act on daily or weekly to improve the experience. If a metric doesn’t inform a staffing decision, a training topic, or a process fix, it’s reportable but not actionable.
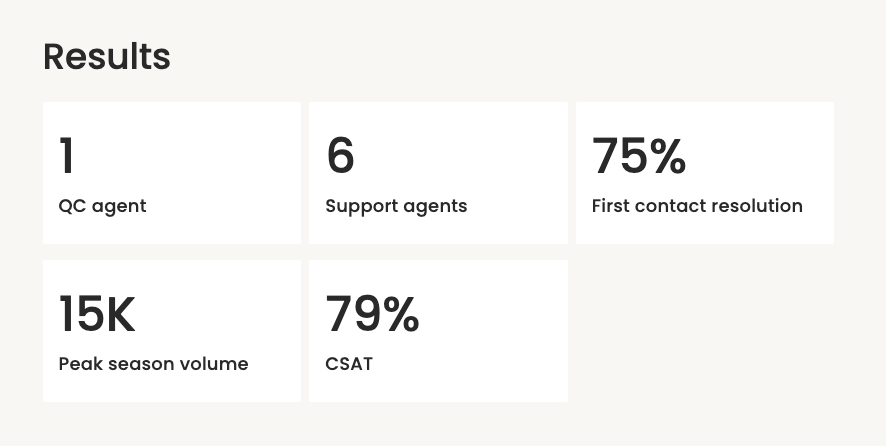
A book summary app that we provide support to, which we learned about early. Instead of celebrating just the rising solved ticket volume, we track the first contact resolution rate as a north-star KPI together. When FCR dips, we know something upstream is broken – usually a product change, a confusing policy, or a gap in agent knowledge. That insight drives immediate action: update help articles, brief the team, escalate to product. The metric becomes a feedback loop, not just a number.
We track metrics as a complete picture, and here are the results:
Customer Service Metrics Examples That Actually Drive Decisions
Let’s look at concrete, decision-ready KPIs grouped by what they help you improve. These customer service metrics examples aren’t exhaustive, but they’re the ones that move the needle when you act on them.
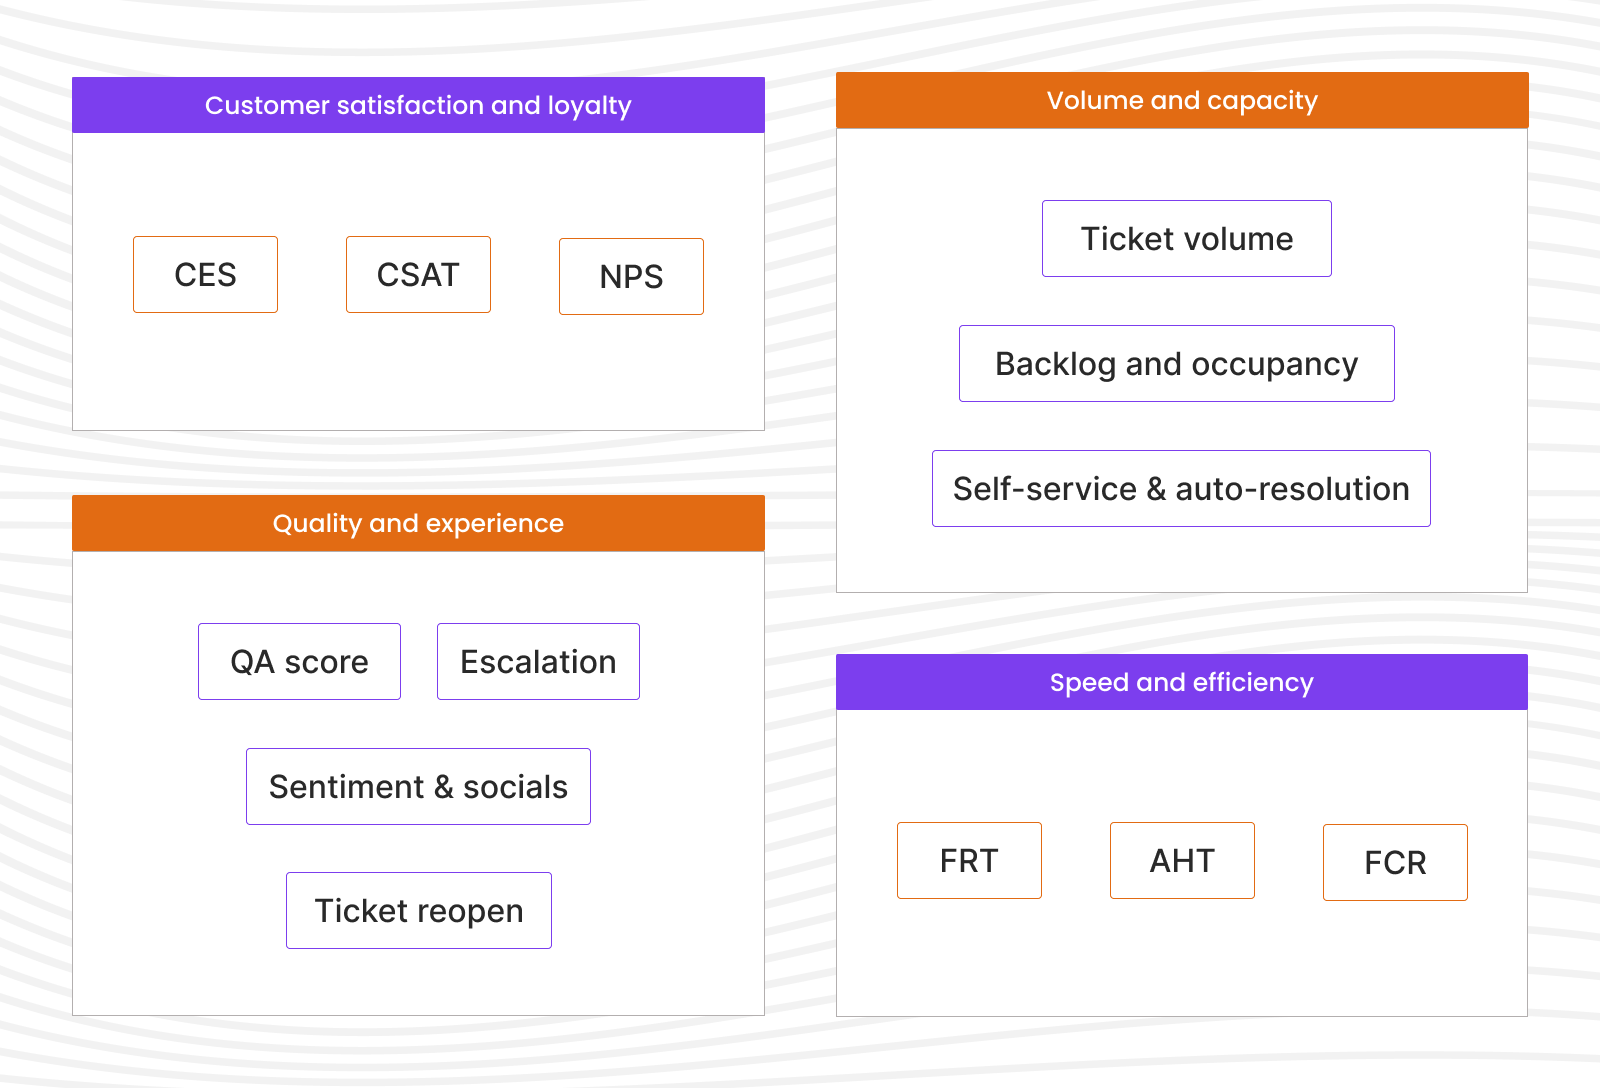
1. Customer Satisfaction and Loyalty Metrics
These measure whether customers are happy, loyal, and likely to recommend you to others.
CSAT (Customer Satisfaction Score)
CSAT measures how satisfied customers are with a specific interaction, usually via a post-contact survey asking “How would you rate your experience?” on a 1–5 or 1–7 scale.
The formula is simple:

A “positive” response is typically a 4 or 5 on a 5-point scale.
Use CSAT trends to spot friction in specific channels or products. If chat customer satisfaction metric drops but email holds steady, investigate whether chat agents need different training or whether the channel is attracting harder questions. If one product consistently scores low, loop in the product team.
NPS (Net Promoter Score)
NPS asks: “How likely are you to recommend us to a friend?” on a 0–10 scale. Promoters (9–10) minus Detractors (0–6) gives you NPS.
Why it matters: It’s a long-term loyalty signal, not a daily operations metric. Use NPS to predict churn and identify advocates, and connect spikes or dips to service changes, product launches, or major policy shifts.
Customer Effort Score (CES)
CES measures how easy or difficult it was for customers to get their issue resolved. The question is typically:
How much effort did you personally have to put forth to handle your request?” on a 1–7 scale (1 = very low effort, 7 = very high effort).
Why it matters: effort predicts churn better than happiness alone. A customer can be “satisfied” with an agent but frustrated by the runaround it took to reach resolution. Use CES to prioritize process fixes – long hold times, confusing IVR menus, missing self-service content – that make support exhausting even when agents are helpful.
2. Speed and Efficiency Metrics
These track how quickly you respond and resolve issues without sacrificing quality or creating rework.
First Response Time (FRT)
FRT tracks how quickly customers hear back after reaching out. In live chat, targets are often under 60 seconds; in email, under 24 hours. Tie targets to channel expectations and customer context.
FRT Example by EverHelp
At EverHelp, maintaining FRT below 45 seconds in live chat is table stakes for excellent customer service. Our team achieves this by staffing to real-time demand using our dashboard to forecast queue depth and agent availability. When FRT starts creeping up mid-afternoon, we know to pull agents from lower-priority channels or defer non-urgent email work.
What’s more, if our client needs even faster FRT, we integrate our AI agent, Evly, for high-volume, low-complexity questions. This way, the FRT gets reduced to 15-30 seconds, and sometimes even less.
{{cta}}
Average Resolution Time / Handle Time
AHT measures how long it takes to close a ticket or complete a call. Read this metric alongside CSAT and reopen rate to avoid “speed for speed’s sake.” If handle time is low but reopens are high, agents are rushing customers off before the issue is solved.
First Contact Resolution (FCR)
FCR is the percentage of issues resolved on the first interaction, with no follow-up needed. FCR is one of the most powerful metrics in customer service because it compresses cost, boosts satisfaction, and frees agent capacity all at once.
Calculate it as:
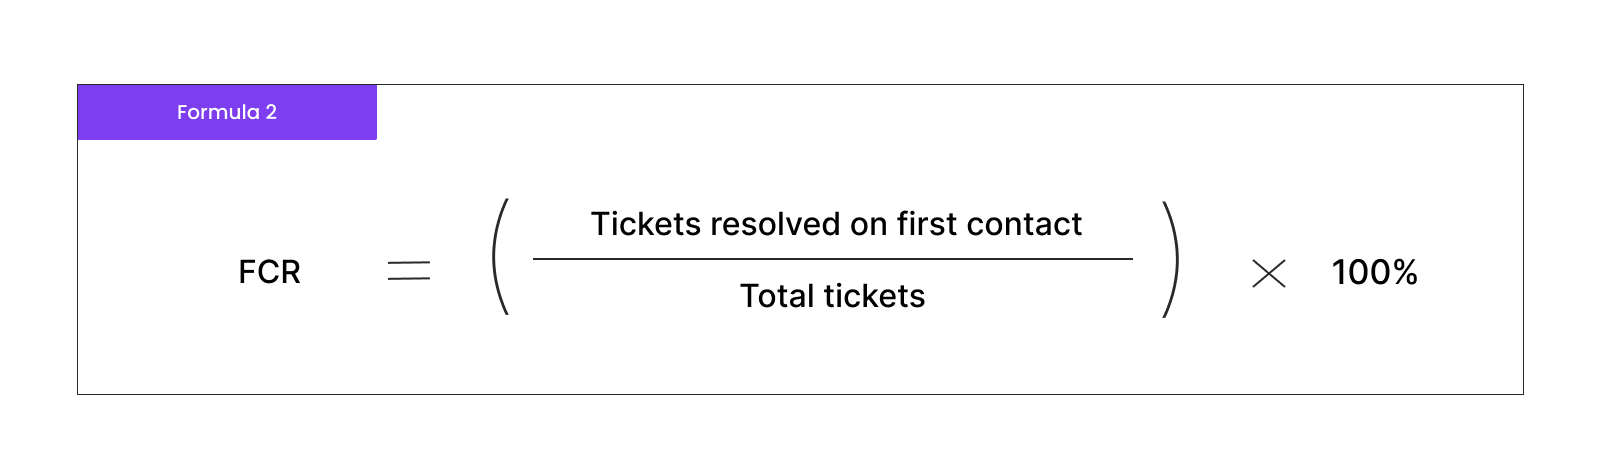
Improving FCR requires investing in agent training, customer support knowledge base depth, and smarter routing so that customers reach the right person the first time.
3. Quality and Experience Metrics
These reveal whether agents are solving problems correctly, with empathy, and in ways that prevent repeat contacts.
Quality Score / QA Score
QA/QC measures how well agents follow best practices, policies, and empathy standards. Many teams score interactions on a rubric covering accuracy, tone, compliance, and problem-solving, often targeting 90%+ or, like EverHelp, a 96% Quality Score.
Use quality assurance metrics to identify coaching opportunities, celebrate top performers, and spot gaps in training or documentation. Pair QA scores with CSAT to validate that internal assessments align with how customers actually feel.
Ticket Reopen Rate
This rate tracks how often customers have to come back because their issue wasn’t truly resolved. A high reopen rate signals knowledge gaps, unclear policies, or agents closing tickets prematurely to hit targets.
Escalation Rate
Escalation shows how often frontline agents hand off to supervisors or specialists. Some escalation is healthy – complex issues should go to experts. But if escalation spikes, it may mean agents lack training, authority, or access to the right tools.
Sentiment and social media metrics
These metrics give a high-level view of brand health. Track mentions, sentiment (positive/neutral/negative), and share of voice across platforms. These aren’t operational KPIs, but they surface reputation risks that operational metrics miss.
4. Volume and Capacity Metrics
These show incoming demand by channel and topic, helping you forecast staffing and spot product issues early.
Ticket Volume by Channel and Topic
It helps you forecast staffing, spot product issues early, and prioritize automation. If 30% of contacts are “Where’s my order?”, invest in proactive tracking notifications. If chat volume doubles every Black Friday, plan staffing months in advance.
Backlog and Occupancy
These show whether teams are sustainably staffed or constantly firefighting. Backlog is the number of unresolved tickets; occupancy is the percentage of time agents spend on productive work (vs. idle). If occupancy consistently exceeds 85%, agents burn out. If backlog grows faster than you can close tickets, you’re understaffed or over-contacted.
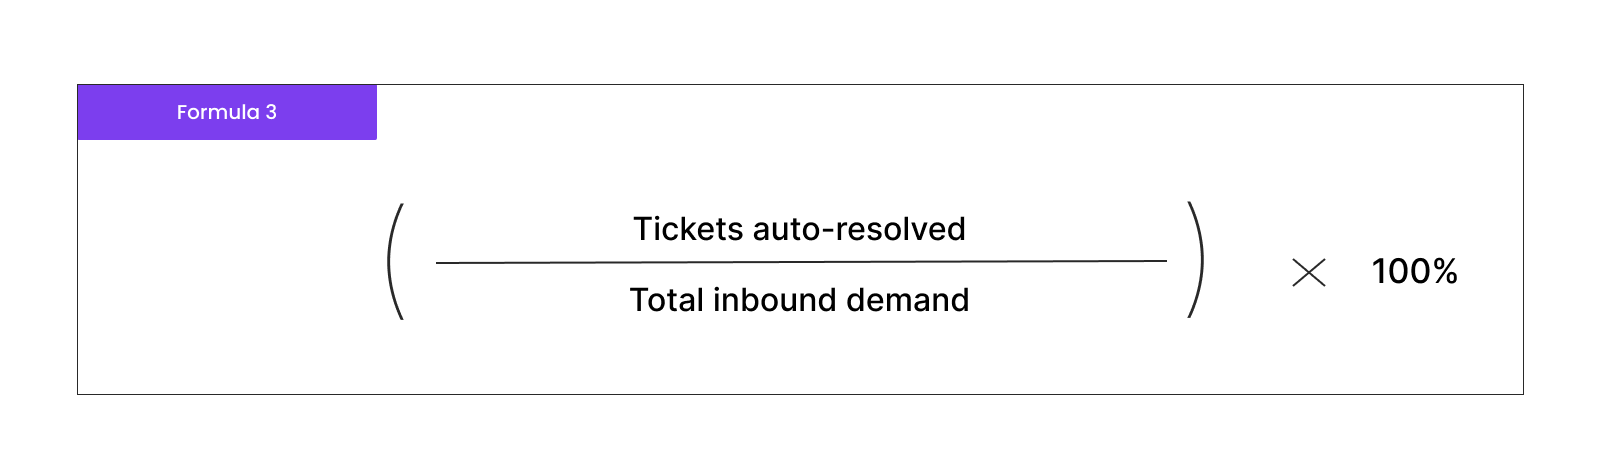
Self-Service & Auto-Resolution Rate
They measure how much demand your help center, chatbots, and automation absorb without human involvement. These are key customer service metrics for scaling efficiently.
Calculate it as:
How Do You Measure Customer Service Metrics?
First of all, you pick what metrics you need to track per your business size and industry you’re in. Then, you move on to setting targets for those metrics and choose software to help you stay on track with your support’s performance.
1. Choose the Right Metrics for Your Business Stage and Model
You can’t track everything, and you shouldn’t. Select 3–7 core customer service KPI metrics tied to where your business is now.
For example, early-stage SaaS companies prioritize activation and retention, so they focus on onboarding completion, time-to-first-value, and CSAT during setup. Mature eCommerce businesses care more about FRT, FCR, and CSAT because they’re handling thousands of repeat customers daily and small improvements in efficiency or satisfaction compound quickly.
Different customer service metrics that matter to different businesses:
- High-touch B2B support cares about relationship quality (NPS), escalation rate, and resolution time because each customer is high-value.
- High-volume transactional support (e.g., delivery apps) optimizes for FRT, FCR, and auto-resolution because efficiency at scale is survival.
- Community-driven products track sentiment, engagement in forums, and peer-to-peer resolution as much as agent metrics.
2. Set Baselines and Realistic Targets
Before setting targets, establish baselines. Run your metrics for at least a month to understand normal variation. Then set incremental goals.
Keep your targets grounded, no matter how ambitious your long-term vision is.
For instance, if your current FCR is 65%, aiming for 96% overnight isn’t realistic. Target 70% next quarter, then 75%. If FRT averages 2 minutes, push for 90 seconds, then 45 seconds over time.
Example of Setting Realistic Targets With Our Client
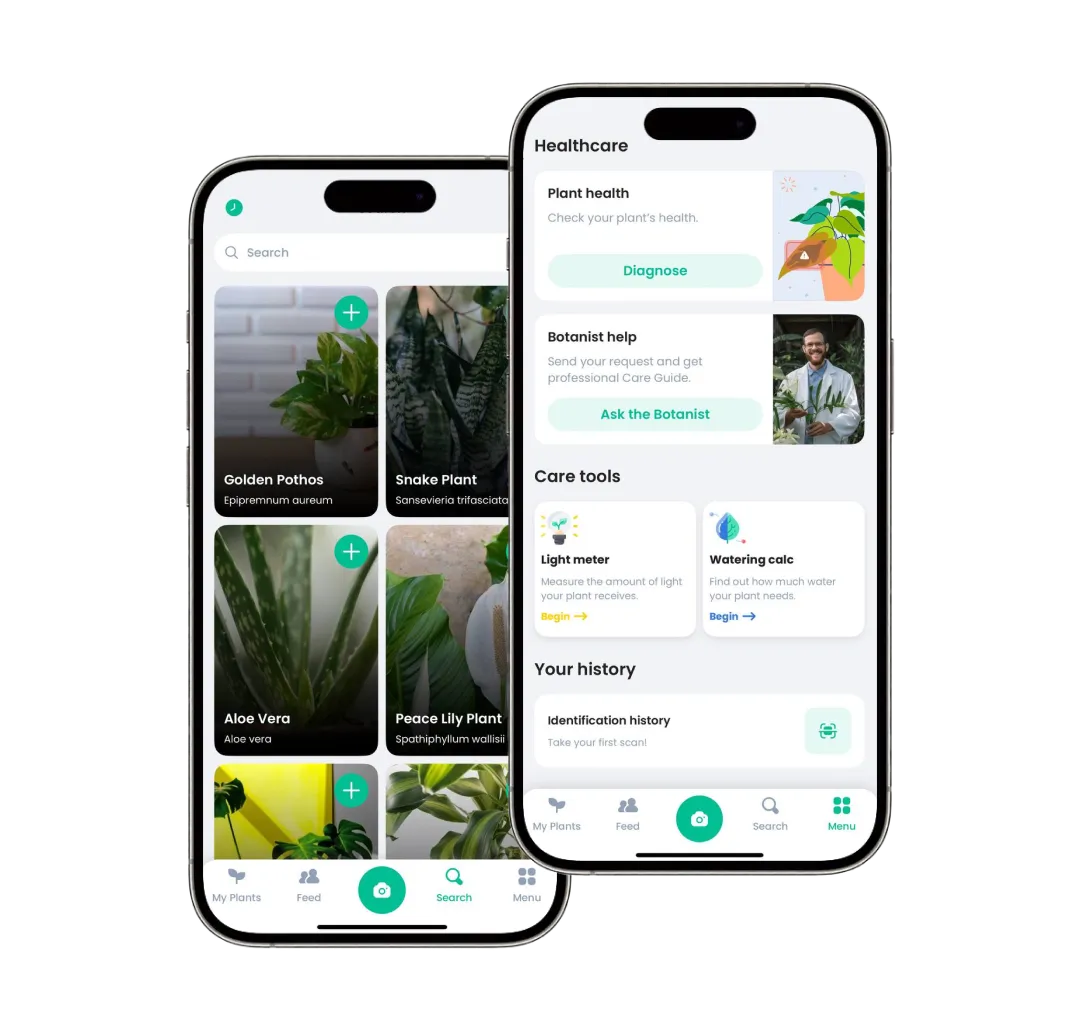
We did such a gradual target shift with our client, a plant identifier app. Before partnering with us, their first replies took up to 6 hours, and full issue resolution could stretch to 72 hours. Over time, we expanded their support channels and systematically reduced their FRT to 8 minutes and full resolution to 3 hours. The improvements didn’t happen overnight – it was a continuous process.
A tip: Use industry benchmarks as reference points, but make targets specific to your channels, complexity, and SLAs. A fintech handling account security questions can’t match the FRT of a chatbot answering “What are your hours?” – and that’s fine, as long as you’re transparent about why.
3. Connect the Right Data Sources and Standardize Tracking
Common customer service data analytics sources include:
- Help desk / CRM platforms (Zendesk, Intercom, Salesforce) for ticket data, handle time, and resolution metrics.
- QA platforms (call center quality assurance software like Kaizo) for scoring interactions.
- Survey tools (Qualtrics, Delighted) for CSAT, NPS, and CES.
- Product analytics (Mixpanel, Amplitude) to connect support interactions to user behavior and churn.
- Telephony data for call duration, hold time, and abandonment rate.
Consistency is critical. Define “resolved” the same way across all channels and over time. If one customer support team closes tickets when they send a reply and another waits for customer confirmation, your FCR and handle time won’t be comparable.
You might like: Freshdesk vs Zendesk. Who wins?
Moving From Static Reports to a Customer Service Metrics Dashboard
Real-time dashboards beat spreadsheets because they let you see problems as they happen and act before customers complain.
Why Do Dashboards Beat Spreadsheets for Decision-Making?
Static spreadsheets hide the story. By the time you export last week's data, compile it, and present it in Monday's meeting, the moment to act has passed. Real-time, unified dashboards let leaders and agents see health at a glance and intervene when metrics drift.
A well-designed customer service metrics dashboard connects customer service performance metrics like CSAT, FCR, and Quality Score with operational levers – staffing levels, queue depth, channel distribution – so you can see why performance is changing and what to do about it.
For example, if your dashboard shows FRT climbing while agent occupancy hits 90%, the fix is obvious: add capacity or defer lower-priority work. If CSAT drops in a specific queue but Quality Score holds steady, the issue isn't agent performance – it's probably a product bug or confusing policy creating customer frustration.
What to Include in a High-Impact Dashboard
Combining metrics helps you distinguish good "fast" from bad "fast." If FRT and handle time are low and CSAT and FCR are high, you're efficient and effective. If speed is great but satisfaction tanks, you're rushing customers and creating problems downstream.
Example: A 24/7 Support Operation in a Single View
EverHelp runs a unified dashboard for different projects that surfaces the metrics that matter most in real time:
- 96% Quality Score tracked via ongoing QA reviews using digital customer service tools.
- <45 second FRT in live chat, monitored continuously with alerts when queues exceed thresholds.
- Volume by queue and channel, helping leaders shift staffing dynamically.
- Alerts and thresholds: when CSAT dips below 80% or backlog exceeds 50 tickets, notifications go to team leads for immediate triage.
These metrics are the foundation. We add additional customer support metrics depending on the industry our client is in. And the goal isn't tracking numbers – it's visualizing success so leaders can see at a glance whether service is healthy, not just how many tickets were closed. When something breaks, they know within minutes, not days.
{{cta}}
Customer Service Metrics That Matter for Different Stakeholders
Executives, support leaders, and frontline agents need different views of the same data to make their best decisions.
What Executives and Founders Need to See
Executives care about business-impact metrics: NPS, churn, retention, customer lifetime value, and overall resolution rate. They want to understand whether support is protecting revenue or putting it at risk.
Show how customer service metrics that matter translate into board-ready narratives:
- "Our NPS increased 8 points this quarter, correlated with a 12% improvement in FCR – customers are getting help faster and staying longer."
- "We reduced escalations by 15% through targeted training, saving 2 hours per day of senior agent time and improving CSAT by 5 points."
Connect support performance to growth, loyalty, and risk. That's the language executives speak.
What Support Leaders and QA Teams Need to See
Support leaders need Quality Score, FCR, CSAT, CES, and reopens to guide coaching, refine playbooks, and fix broken processes. They use trend lines to decide when to add headcount, adjust routing, or invest in training.
If reopens spike for a specific issue type, that's a signal to update the knowledge base or create a macro. If one agent's Quality Score is consistently low, that's a 1:1 coaching conversation. If CES climbs despite good CSAT, that's a process problem – too many handoffs, unclear policies, or friction in customer support channels.
What Frontline Agents Should See Daily
Agents benefit from mini-dashboards showing personal CSAT, FCR, Quality Score, and handle time in context – not as a surveillance tool, but as a feedback mechanism.
When agents see their metrics alongside team averages, they can self-correct. If their handle time is 30% higher than peers, they might ask for efficiency tips. If their CSAT is top-tier, they know what they're doing is working.
Share the "why" behind metrics. Explain that FCR isn't about speed – it's about solving the problem completely so customers don't have to come back. When agents understand how metrics connect to customer outcomes, engagement improves and they start owning results, not just completing tasks.
Metrics by Stakeholder, Summarized
Turning Customer Service Metrics Into Better Decisions
Establish a feedback loop that takes action immediately after a change occurs. Don’t get stuck in the past – keep refreshing your metric set as your business needs change.
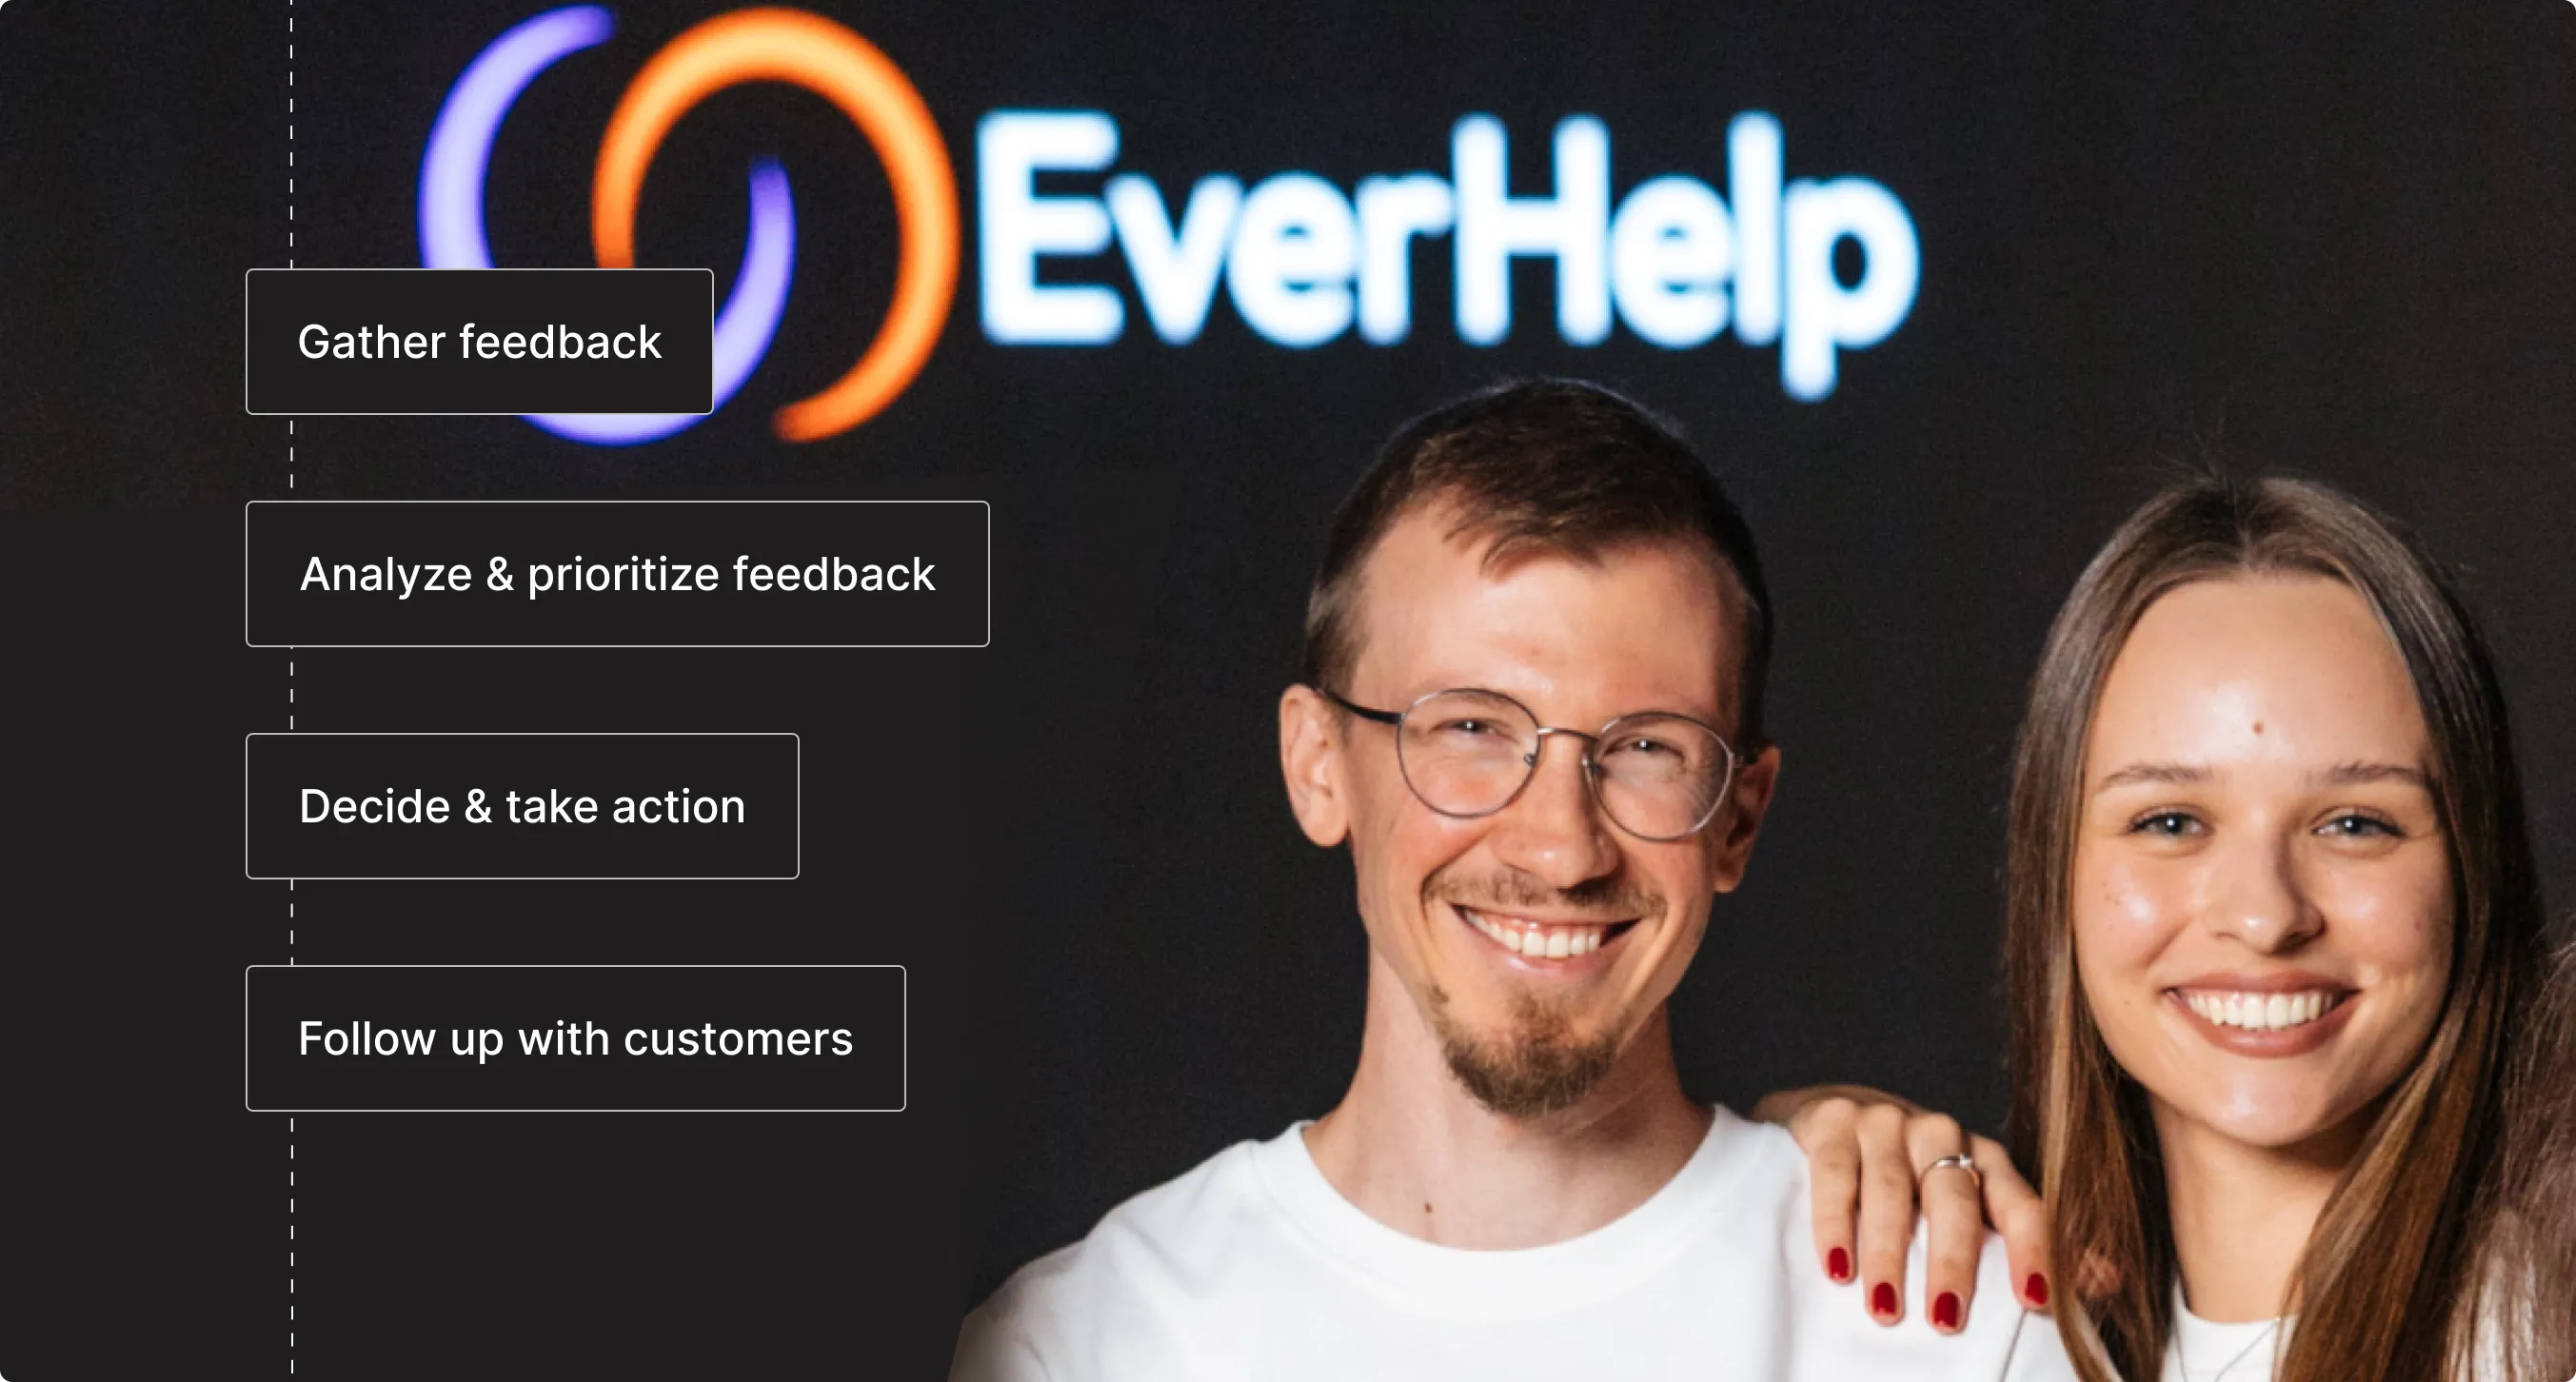
Build a Feedback Loop From Metrics to Action
The best customer service metrics examples are part of a simple loop: measure → interpret → decide → act → review. Metrics are the starting point, not the finish line.
Examples of this loop in action:
- Lowering FRT: Dashboard shows FRT climbing during afternoon peaks. Decision: staff chat during 2–5 PM and defer email responses to off-peak hours. Action: adjust schedules. Review: FRT drops back to 45 seconds.
- Reducing CES: Customers report effort when navigating the help center. Decision: simplify article structure and add search suggestions. Action: redesign self-service flows. Review: CES improves, self-service rate increases.
- Improving Quality Score: QA reveals agents struggle with empathy on refund requests. Decision: create empathy training and refund scripts. Action: run workshops and update playbooks. Review: Quality Score climbs from 89% to 96%.
Each metric should connect to a lever you can pull: staffing, training, routing, content, product feedback, or policy clarification.
Avoid Common Pitfalls and Gaming
Metrics get gamed when incentives misalign with outcomes. Agents rush to close tickets to hit AHT targets, creating reopens. They ask for only positive survey responses, inflating CSAT. They avoid tough questions to keep handle time low.
The fix is balancing customer service metrics so no single KPI can be gamed without consequences showing up elsewhere:
- Pair handle time with FCR and CSAT
- Track reopens alongside closure rate
- Monitor Quality Score, not just speed
Avoid binary targets ("everyone must hit 95% CSAT or else"). Instead, use metrics as coaching signals: "Your CSAT is trending down – let's listen to calls together and see where we can improve."
When to Refresh Your Metric Set
The "right" metrics in customer service change as the business, product, and channels evolve. What matters at launch (activation, initial CSAT) differs from what matters at scale (efficiency, retention, self-service).
Review your metric set quarterly:
- Retire vanity metrics that don't inform decisions (e.g., raw ticket counts).
- Promote new KPIs that align with current goals (e.g., add sentiment tracking when launching on social media).
- Keep your dashboard focused and actionable – 7 metrics you act on beat 20 you glance at.
We at EverHelp revisit our KPIs every quarter as they expand into new markets and channels, ensuring our customer service metrics dashboard reflects what drives success today, not what mattered last year.
Final Thoughts: Visualizing, Not Just Counting, Success
Customer service metrics should answer
"Are we delivering an experience that earns loyalty?" not "How many tickets did we touch?"
The shift from static reports to real-time dashboards isn't cosmetic – it's strategic. When you can see quality, speed, and sentiment in one place, you stop reacting to last week's problems and start preventing this week's.
If you're still managing support performance in spreadsheets, it's worth asking what decisions you're not making because the data comes too late or lacks context. The metrics are there. The question is whether you're using them to make better charts or better decisions.
Ready to turn metrics into real impact? Reach out to us as your trusted customer service partner and start making smarter decisions today.


Table of contents
Help someone else stay in the know. Hit that share button!


.webp)


.webp)

%20(1).png)


.webp)
.webp)
%20Rate%20Smartly.webp)

.webp)


.webp)


.webp)
.webp)

.webp)