


The 2026 SaaS retention benchmarks every founder should know

TL;DR: In 2026, SaaS retention benchmarks have become a primary valuation input – not a vanity scorecard. The median annual B2B SaaS retention sits around 88–90%, but top performers push NRR above 120% by combining proactive support, AI-driven churn detection, and smarter onboarding. This article breaks down the metrics that matter (CRR, GRR, NRR, churn, DAU/MAU), explains how to calculate them, and shows – with a real case study – how AI-driven support moves the numbers that boards actually watch.
The era of "growth at all costs" is over. Boards and investors are now scrutinising SaaS retention benchmarks with an intensity that would have felt excessive three years ago – because retention has become a core valuation input. When the median annual customer retention for B2B SaaS sits in the high 80s to around 90%, a five-point gap above or below translates into millions of ARR at scale. At EverHelp, we partner with SaaS and app companies on user retention and SaaS Support – and this article turns those raw numbers into a practical playbook.
The 3 SaaS retention benchmarks you need to track in 2026
Before you can improve retention, you need clarity on what "retention" actually means — because the term covers at least two very different things. This section covers the three core metrics every SaaS team should track: Customer Retention Rate (CRR), Gross Revenue Retention (GRR), and Net Revenue Retention (NRR).
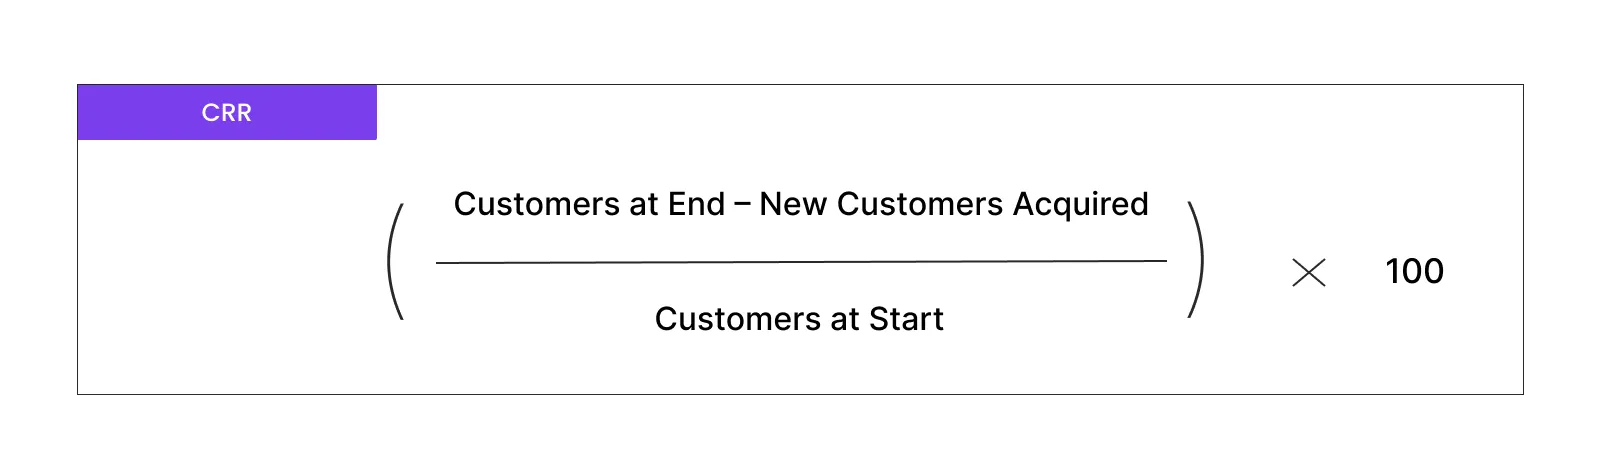
1. Customer Retention (Logo Retention)
This tracks the raw number of accounts you keep over a given period. Lose 10 out of 100, and your annual rate is 90%. Simple – but flat. It weighs a $500/month account the same as a $50,000/month one: a useful starting point, but a poor North Star.
2. Revenue Retention (The Investor’s North Star)
Revenue retention weights accounts by monetary value, giving a far more accurate picture of business health. It splits into two key metrics:
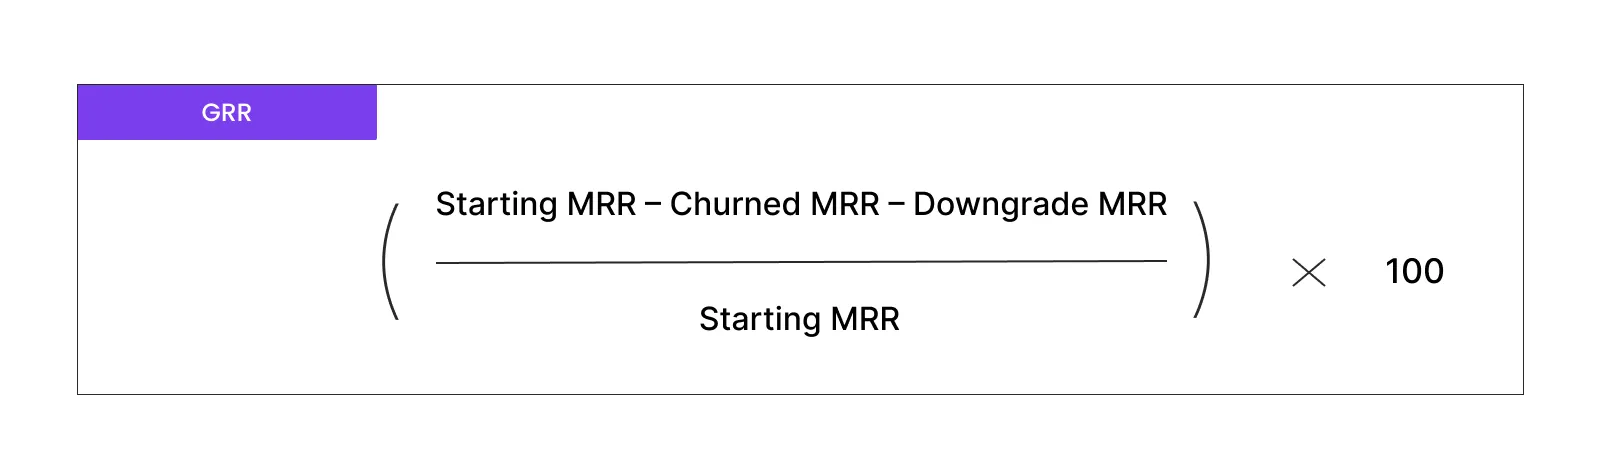
2.1. Gross Revenue Retention (GRR)
GRR strips out expansion to show pure retention – how well you hold onto existing revenue before any upsells. It can never exceed 100%, which makes it the clearest early warning for product-value fit issues.
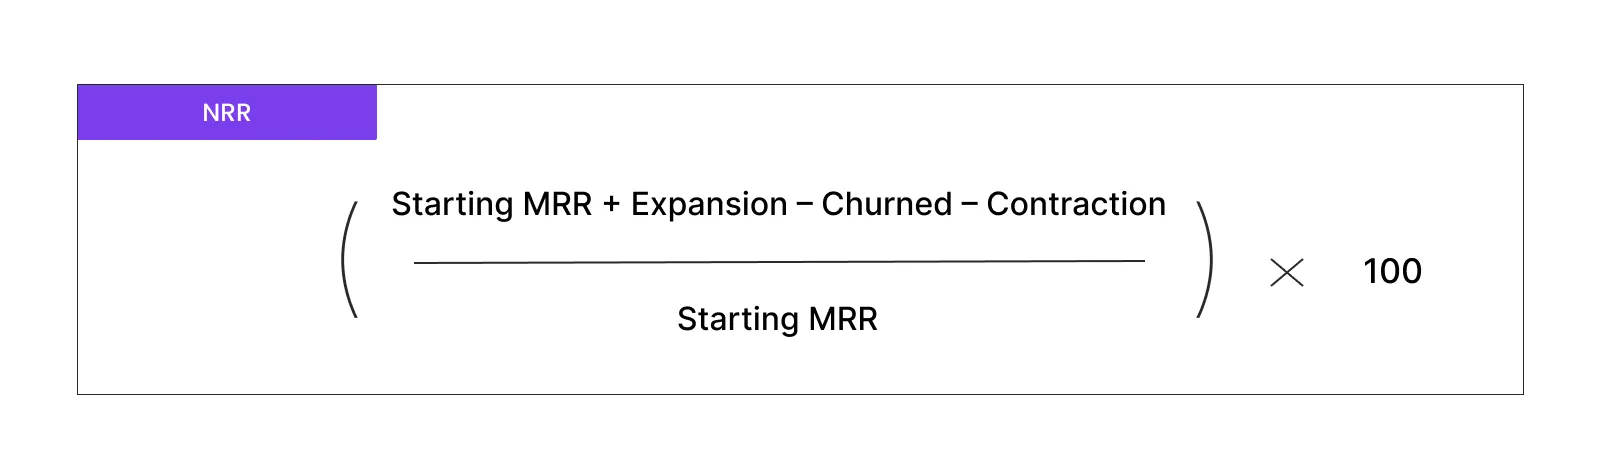
2.2. Net Revenue Retention (NRR)
NRR layers expansion back in – upsells, cross-sells, seat additions – making it the metric investors look at first. It's the only number that shows whether your existing customer base is growing or shrinking on its own.
3. Where the 2026 SaaS customer retention metrics actually land
- Annual CRR: 88-90% median for B2B SaaS; top-quartile teams push 90%+ consistently.
- GRR: Median 82-90%; best-in-class 92%+.
- NRR: Median 100-104%; strong B2B SaaS targets 120%+.
The gap between average and top performers is wider than most founders expect. Aggregate B2B SaaS data shows the broad average sits well below what top-quartile teams achieve – at $5M ARR, that gap means hundreds of thousands of dollars of lost revenue annually, before expansion compounding enters the picture. Good retention is the floor. The top quartile is the target.
Pro tip: Identify your single biggest retention breakpoint – usually onboarding drop-off or first-renewal friction – and solve that first.
The North Star: SaaS customer retention metrics that actually matter
Stop tracking vanity metrics and start optimizing for the ones that move the needle. When we audit clients' dashboards, we routinely find teams measuring dozens of KPIs while ignoring the handful that actually predict revenue outcomes.
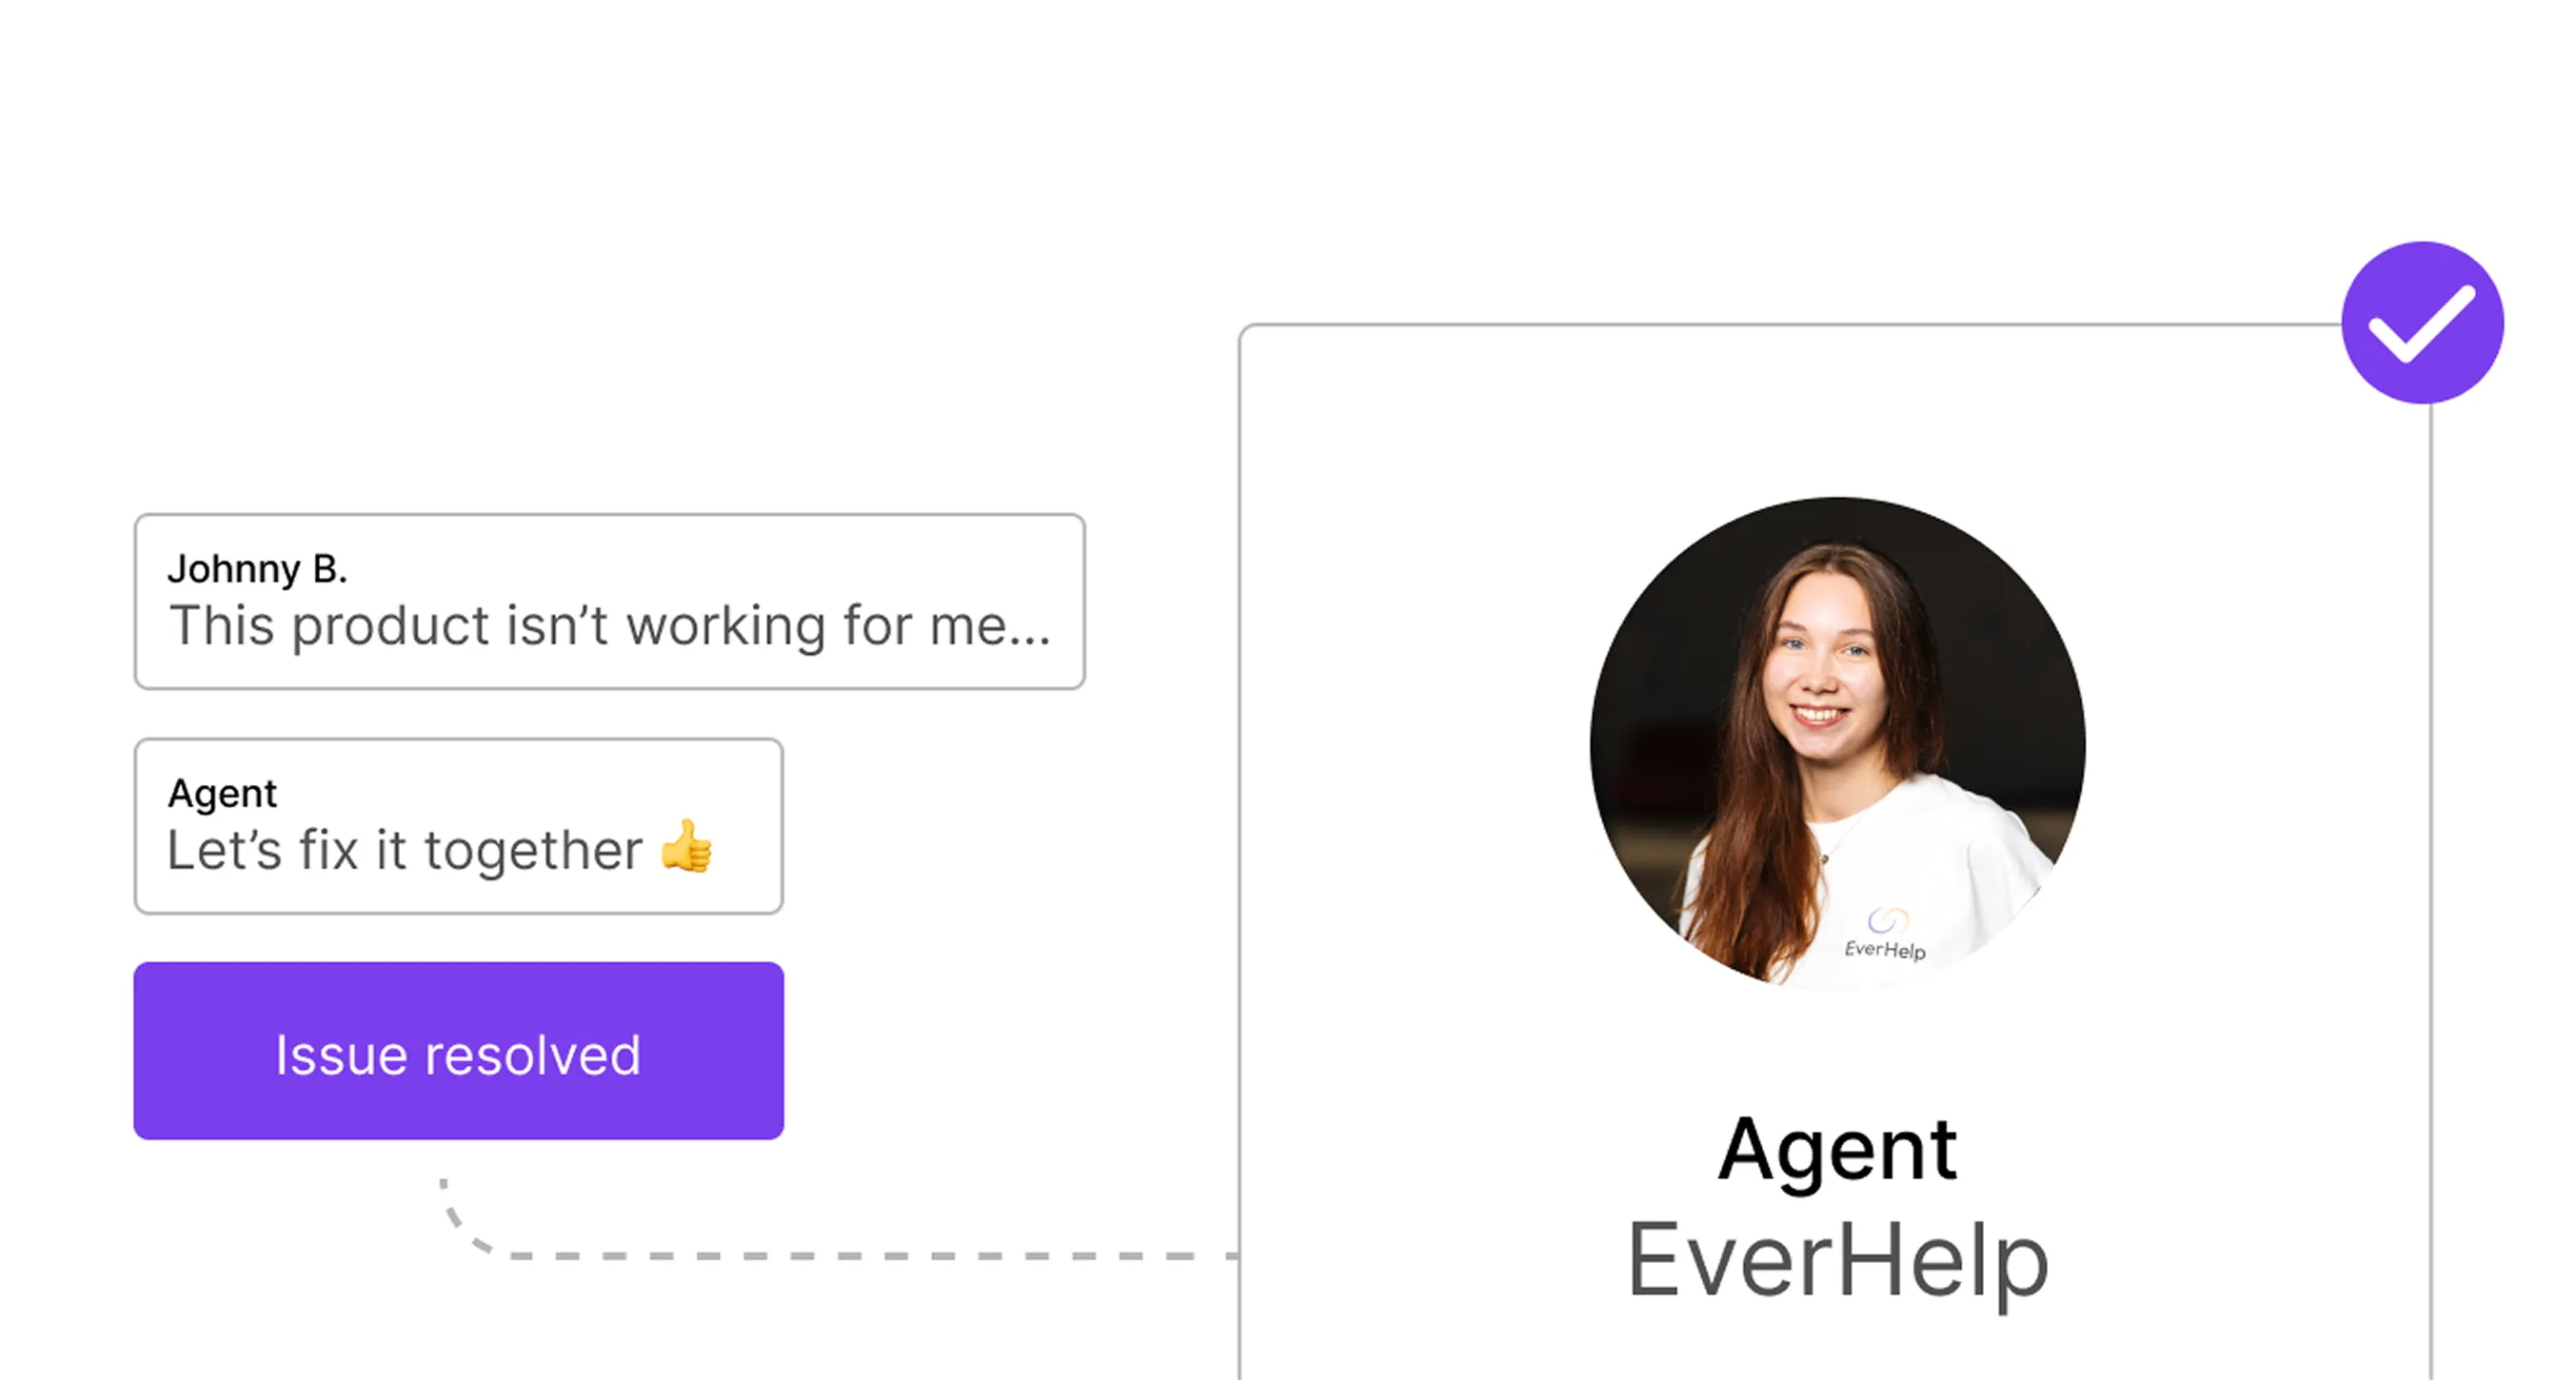
Title is a good example: their team was monitoring ticket volume and response time, but no one had connected support friction at the trial-to-paid transition to their renewal rate. Once EverHelp surfaced that link and built interventions around it, 3-month retention moved above the category baseline. See the full case study for details.
Why Net Revenue Retention is the king of 2026
NRR measures how much recurring revenue you retain and expand from existing customers, excluding new business entirely. Start a quarter with $1M in MRR, end it with $1.1M after churn, downgrades, and upgrades – your NRR is 110%.
2026 NRR benchmarks at a glance:
- 100–104% – median; expansion keeping pace with churn
- 120–130%+ – best-in-class; existing customers driving growth without new logos
- Below 95% – revenue is eroding quarter over quarter
Why NRR beats MRR growth as a North Star:
- Captures expansion, downgrades, and churn in a single number
- Ties directly to capital-efficient, lower-CAC growth
- Removes dependency on expensive new logo acquisition
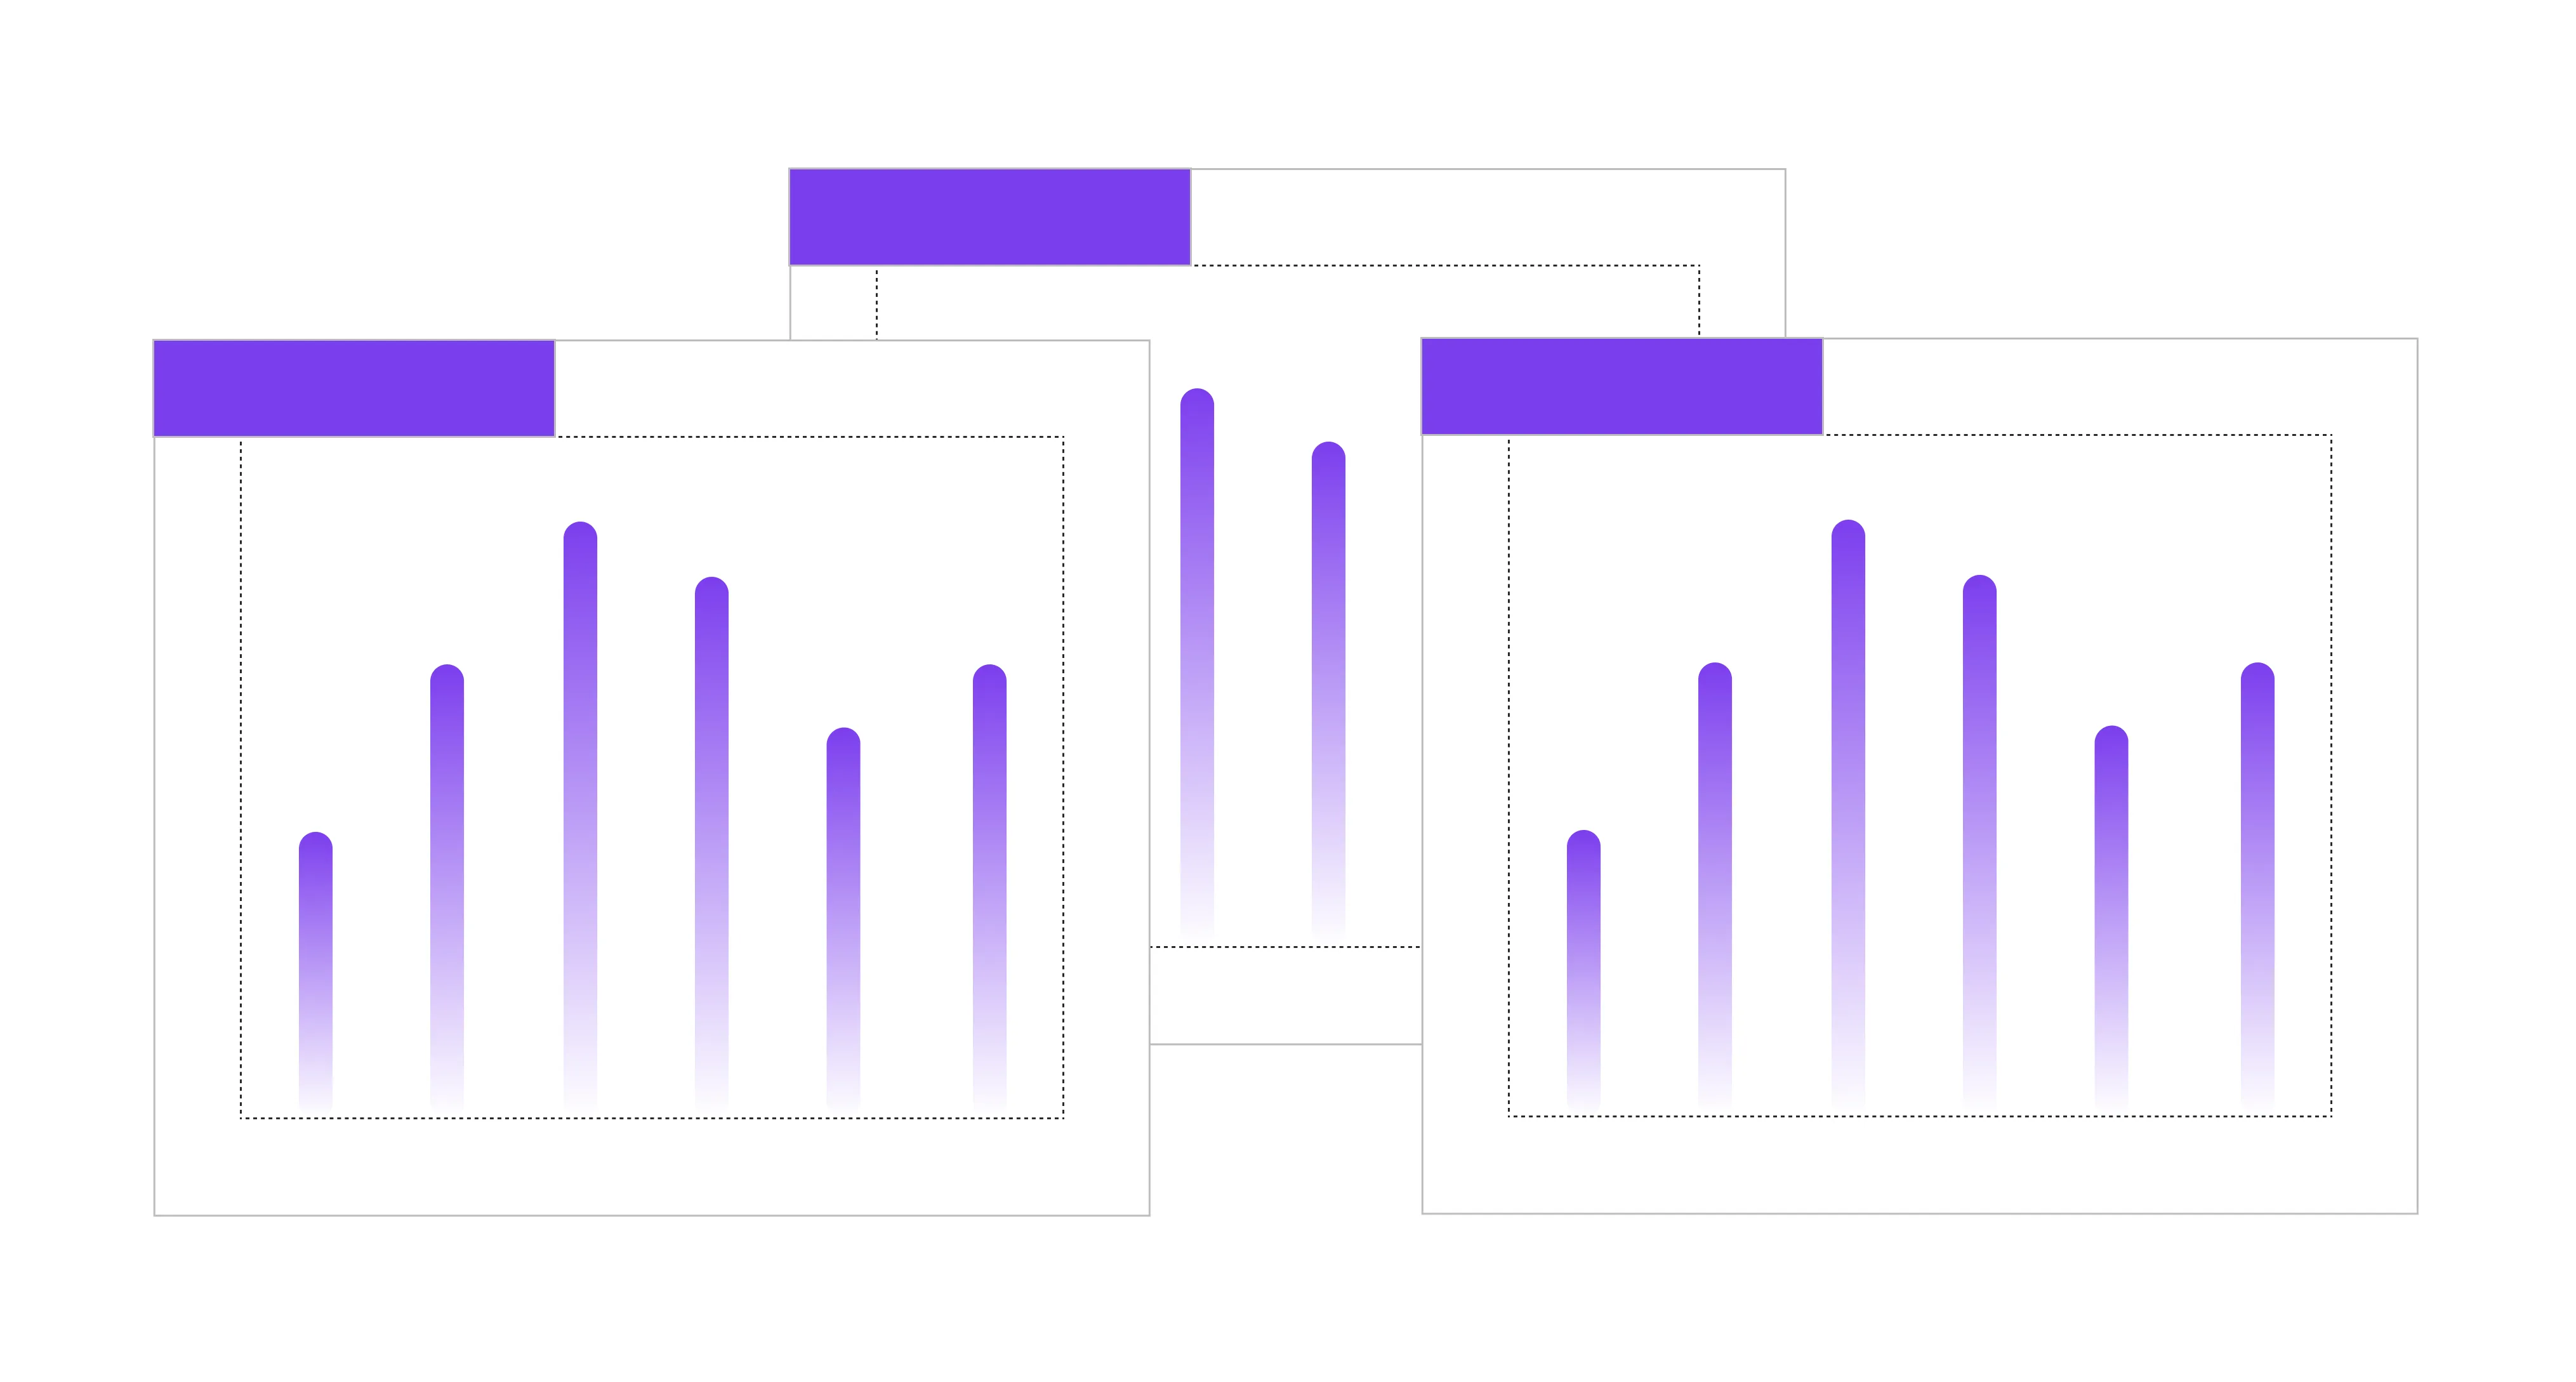
2026 retention metric shortlist
Instead of 25 KPIs, optimize for these. The table below covers the core SaasS customer retention metrics every B2B SaaS team track consistently.
Source: SaaS Capital 2025 Private B2B SaaS Retention Benchmarks
SaaS customer retention rates by industry (and app retention benchmarks)
One of the most common mistakes we see is benchmarking against the wrong peer group. Understanding SaaS customer retention rates by industry stops you from optimizing toward the wrong number.
B2B SaaS vs other models
- B2B SaaS: Average annual retention around 88–90% for well-run stacks.
- E-commerce: Around 80%, driven by lower switching costs and transactional relationships.
- Consumer subscription apps: More volatile — higher acquisition volumes, thinner loyalty, and faster churn when perceived value dips.
App retention rate benchmarks
According to AppsFlyer and Statista data, the drop-off is sharp:
- Day 1: ~25% of users return after installation
- Day 7: Drops to roughly 10–11%
- Day 30: As low as 5–6% across most categories
- Day 90: Only habitual-use categories – finance, fitness, subscription learning – hold meaningfully higher
The lever that bridges app-level user retention to account-level NRR is activation: whether users hit their "aha moment" quickly enough to stick.
{{cta}}
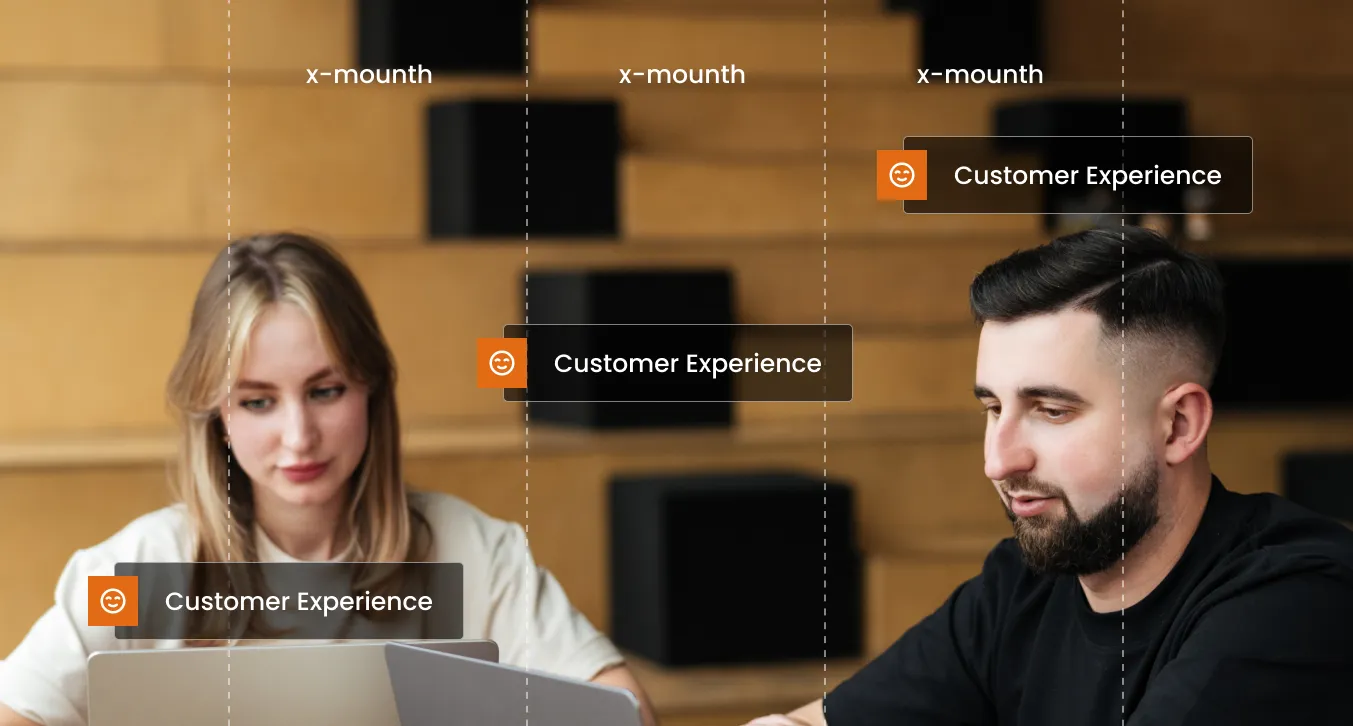
App retention rate benchmarks: how our clients compare
In our work supporting apps across CRM integrations and customer support, modest improvements in early retention cohorts compound into meaningful NRR gains. Here's what EverHelp delivered for each:
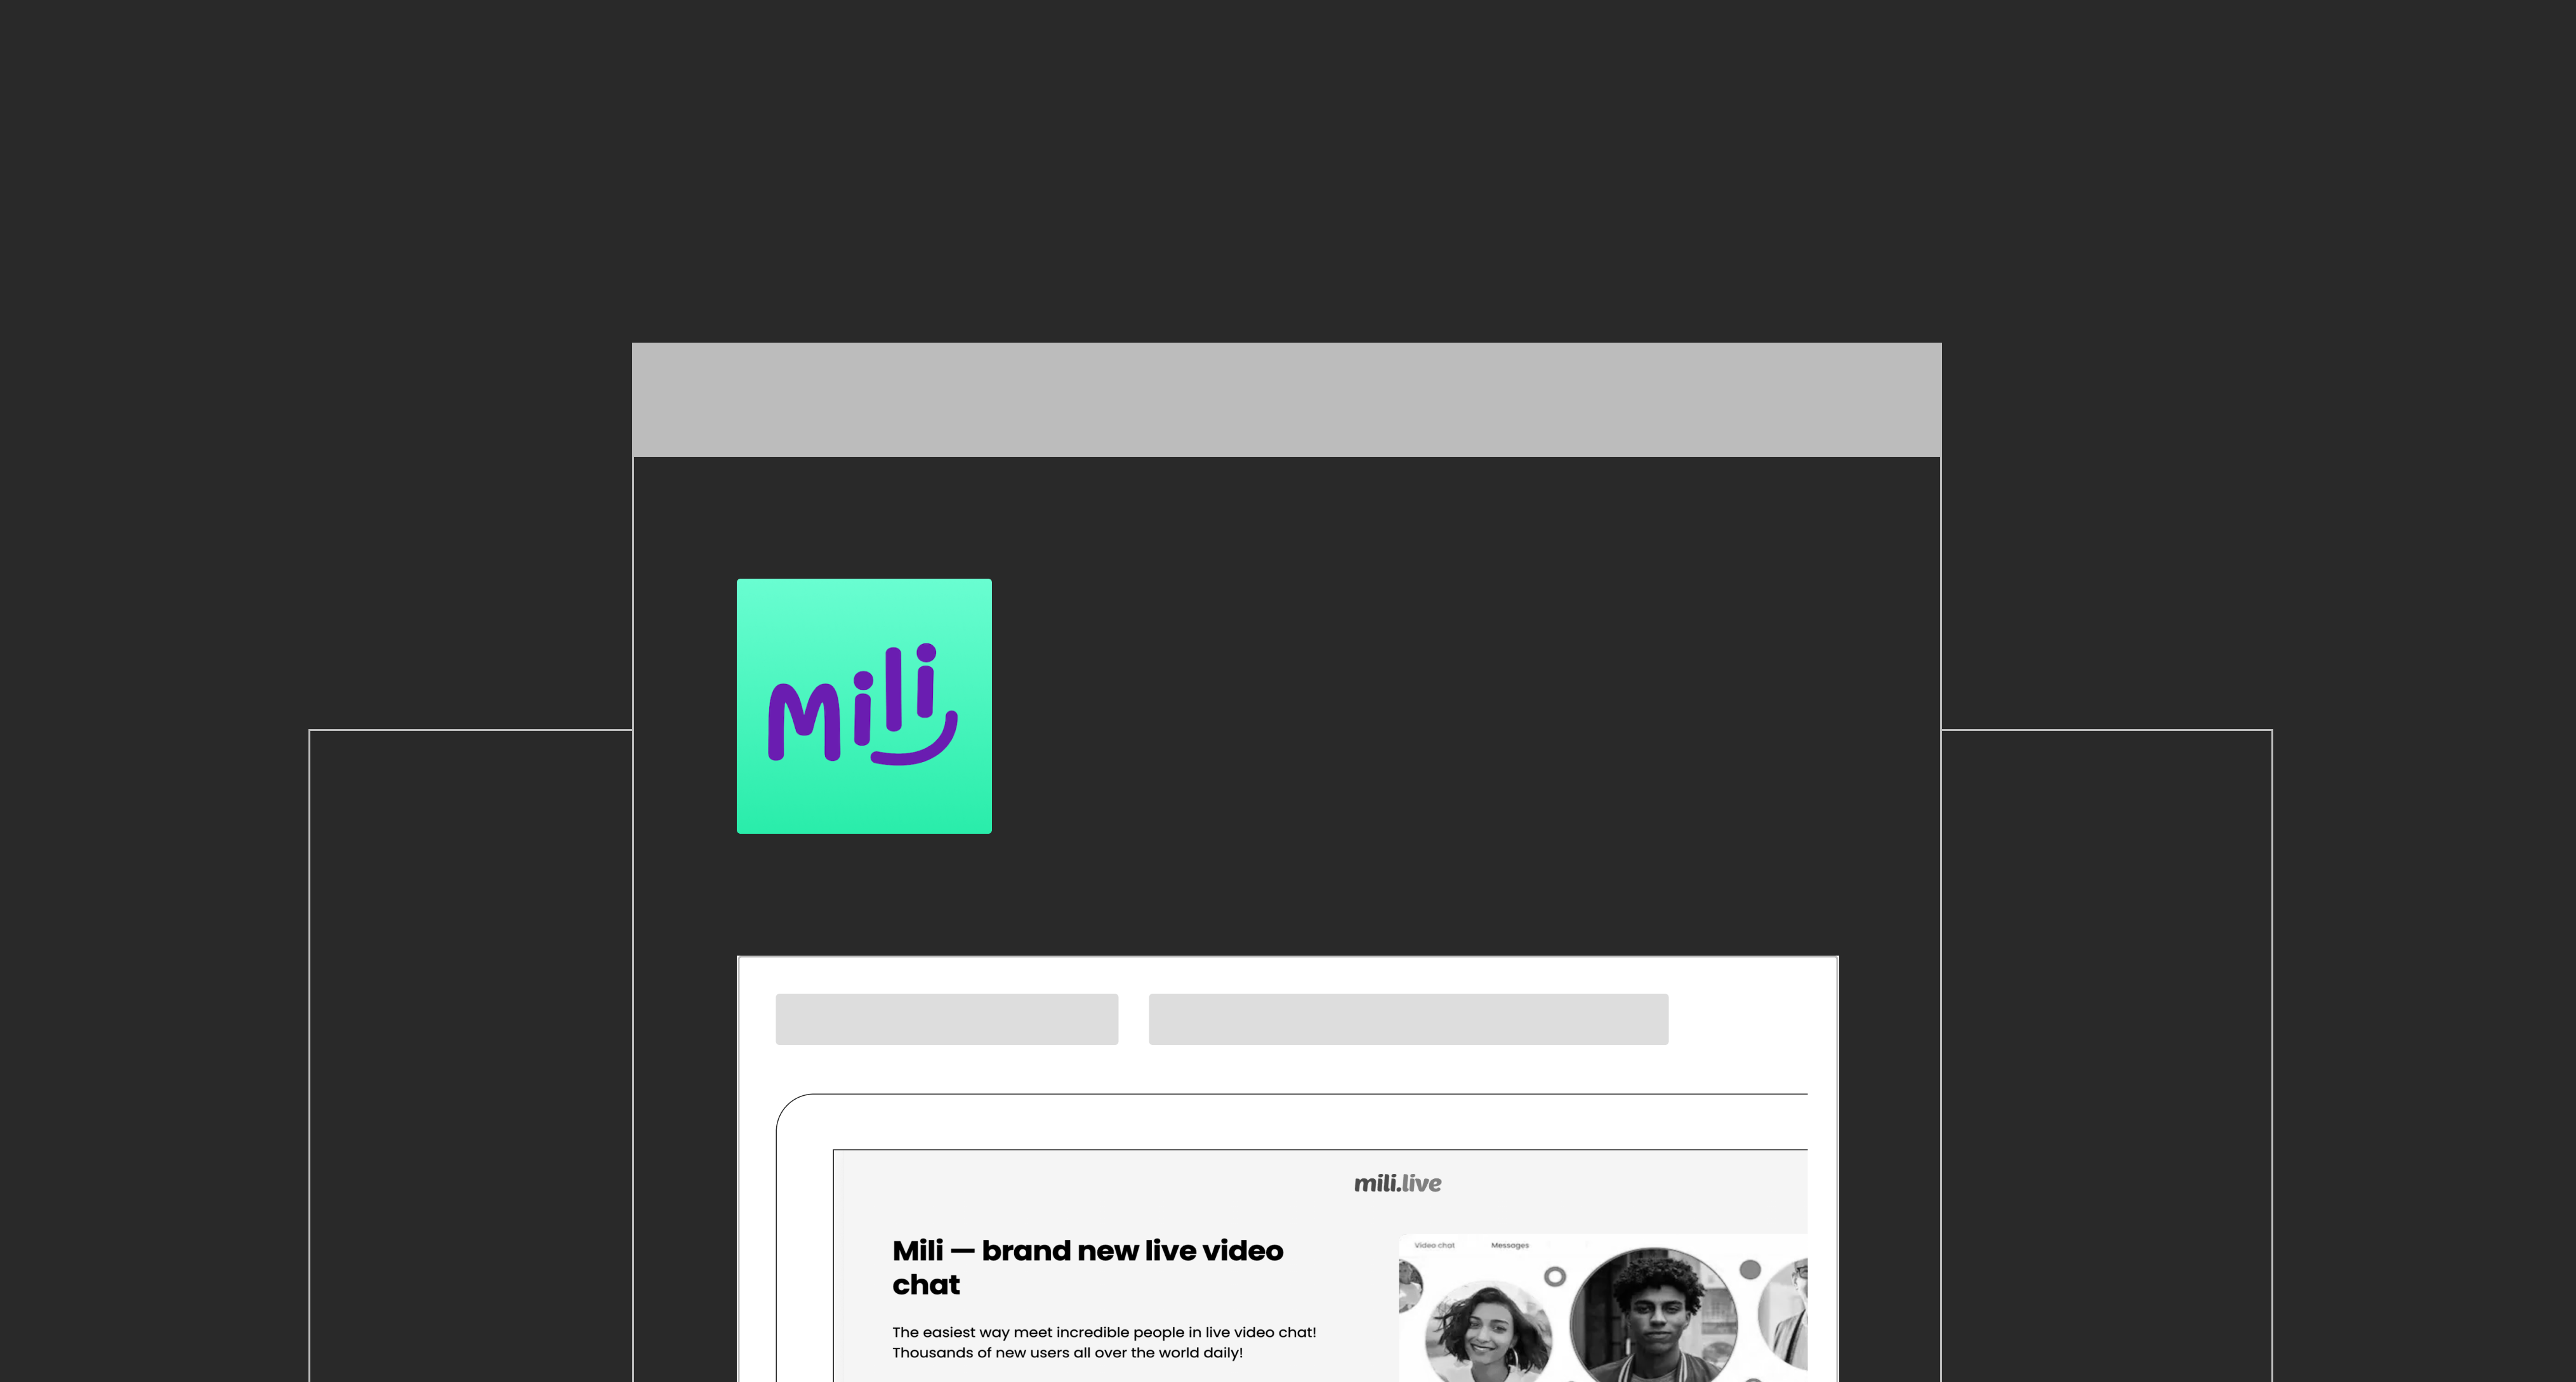
Headway
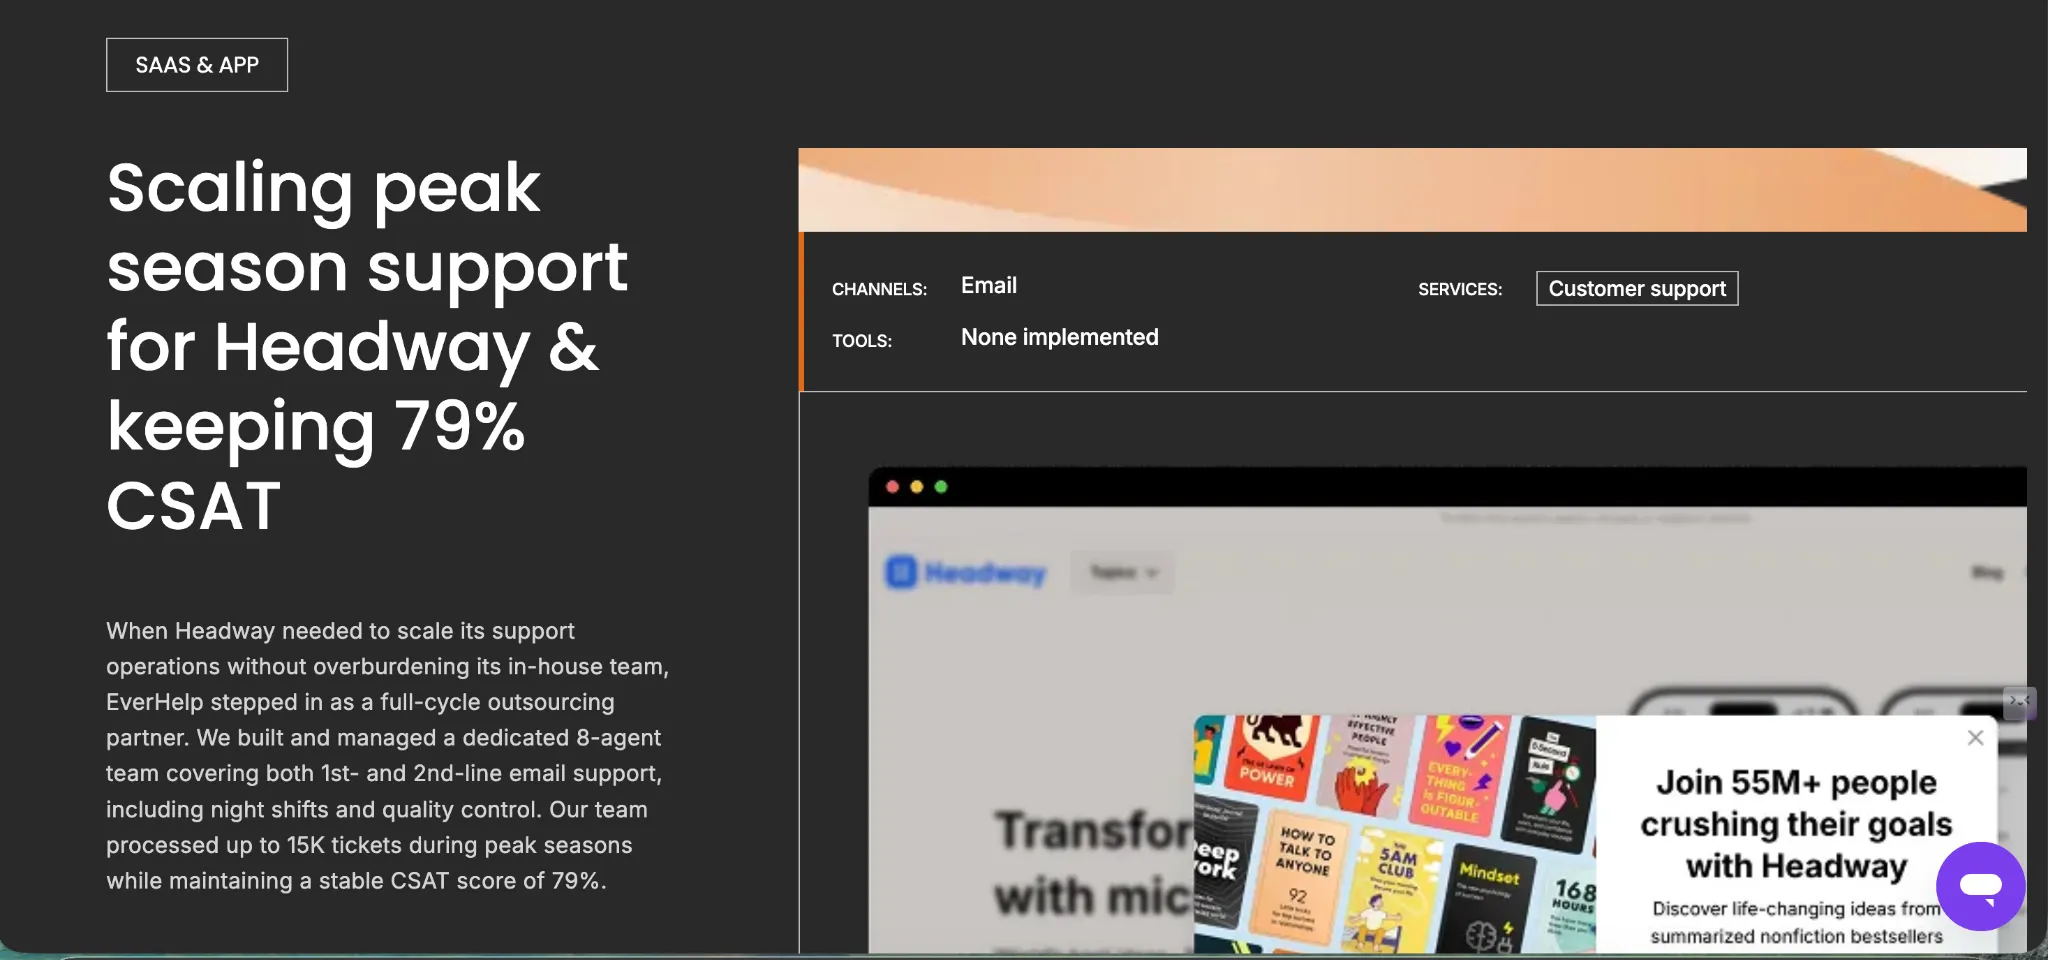
Book summary and learning app, 10M+ downloads, 150+ countries
- What EverHelp did: Built a dedicated support team handling onboarding and billing queries, generating early friction; deployed proactive win-back messaging at free-trial expiry.
- Result: 3-month retention pushed above industry average; measurable improvement in paid renewal rates.
Keiki
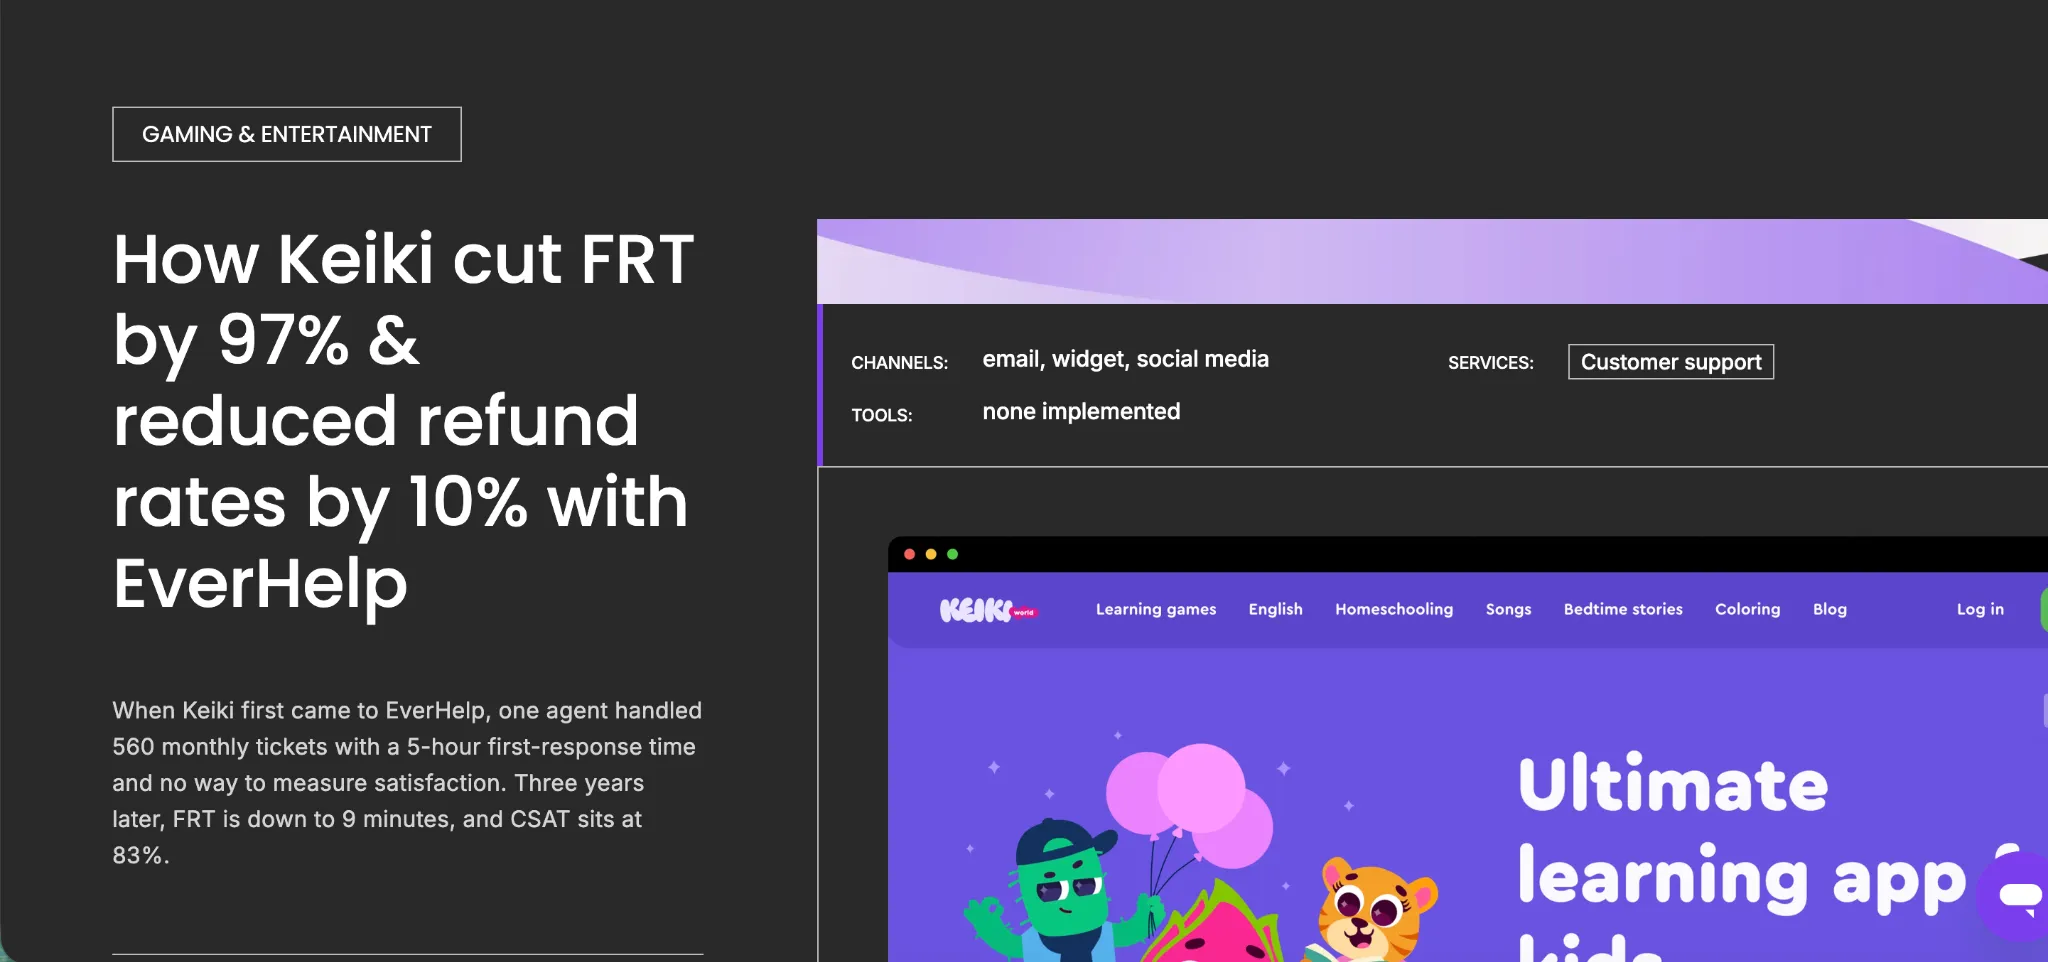
Kids' educational app, trusted by 12M+ families
- What EverHelp did: Restructured support during the first-week onboarding window via improved SaaS onboarding flows and faster query resolution.
- Result: Tightened first-week user retention; reduced early drop-offs, suppressing paid conversion from trial.
Title
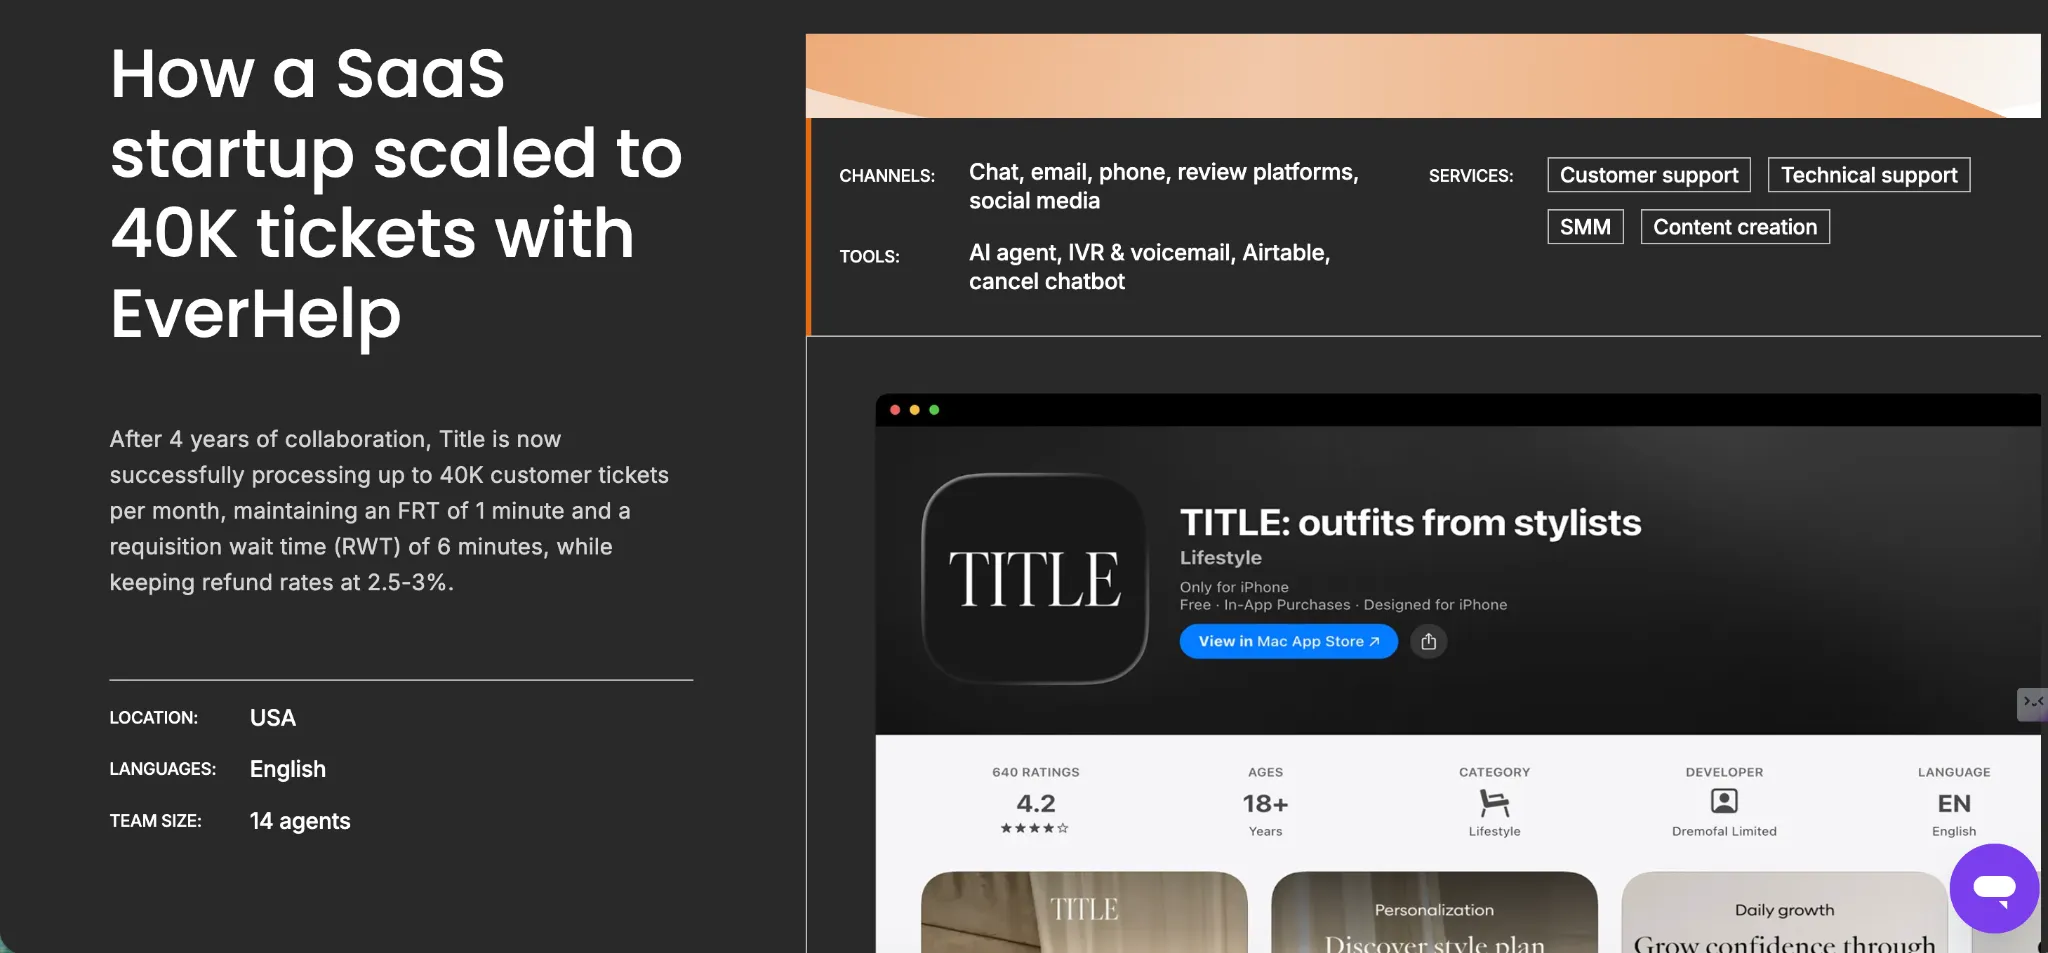
Personal styling subscription app, 500K+ users
- What EverHelp did: Deployed AI-assisted proactive messaging at key drop-off points, reaching users before disengagement.
- Result: Above-benchmark 3-month user retention versus category baseline; measurable reduction in voluntary cancellations.
Key SaaS customer retention formulas (with simple examples)
CRR example: 200 start, 190 end, 10 new → CRR = 90%.
GRR example: $100K start, $5K churn, $3K downgrades → GRR = 92%.
NRR example: $100K start, $12K expansion, $5K churn, $3K downgrades → NRR = 104%.
To annualize: 1 – (1 – monthly rate)^12. A 3% monthly rate compounds to ~31% annually – not 36%.
Even a 1-2 point monthly improvement is highly valuable at scale.
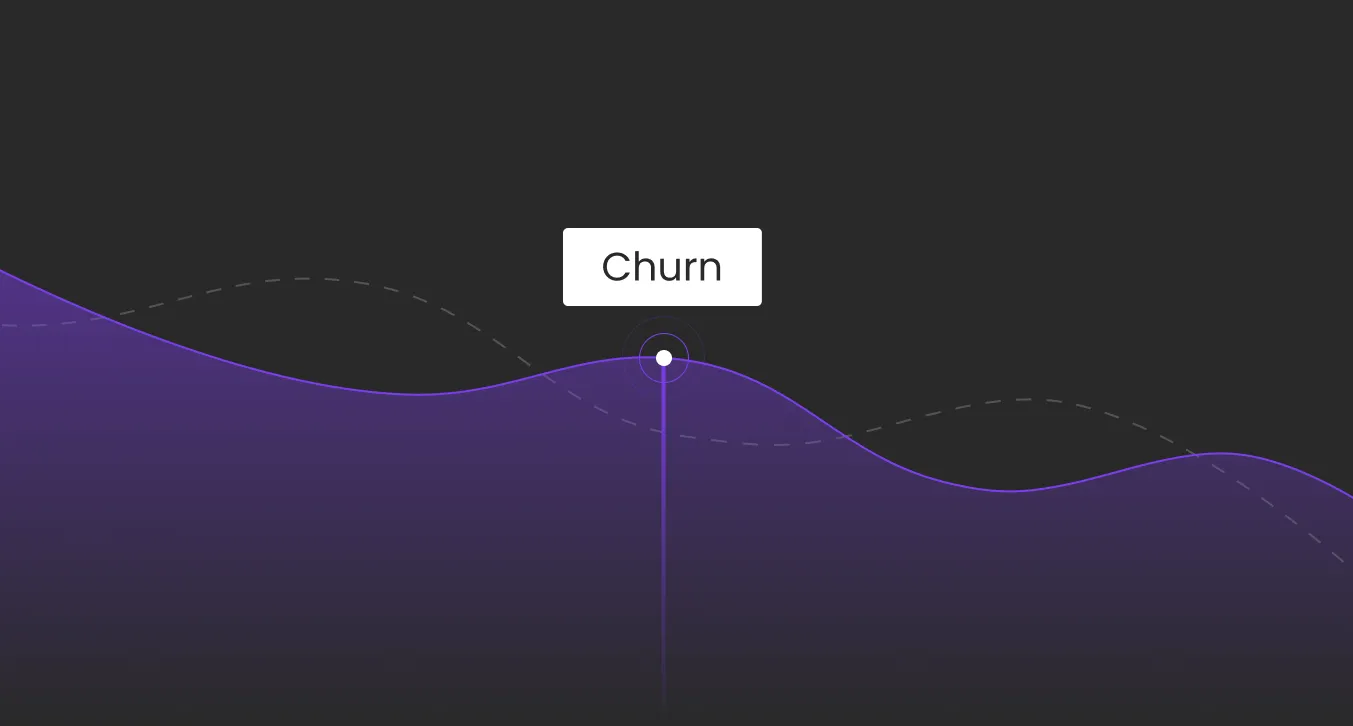
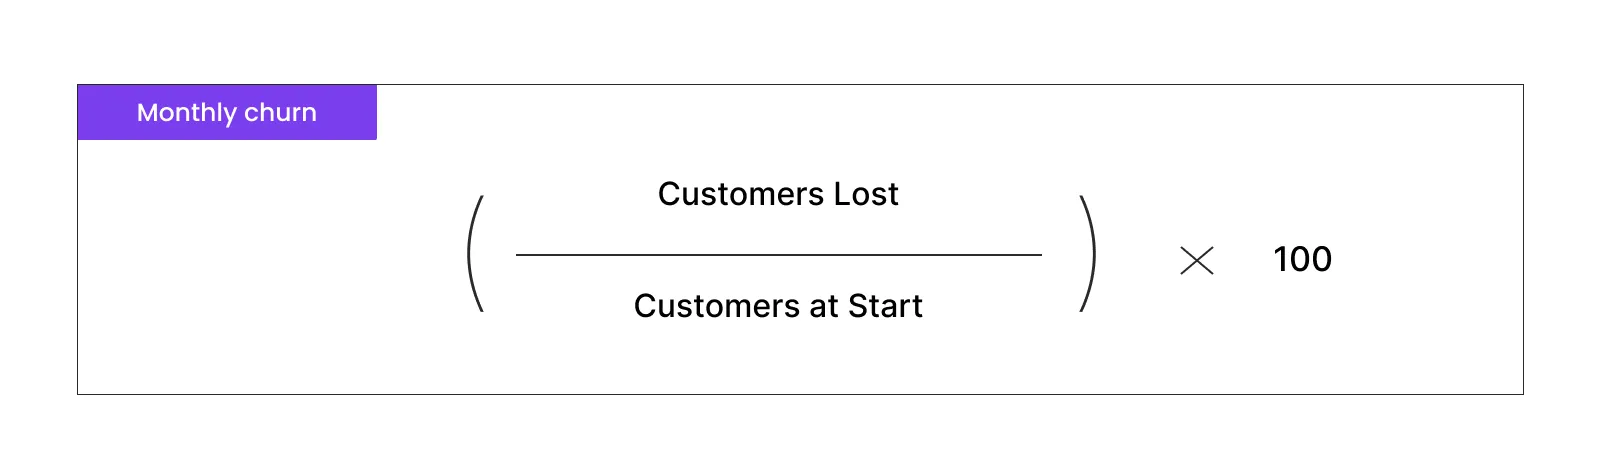
SaaS churn rate benchmarks you can't ignore
Now that you know how to calculate churn, the next question is: what does "bad" actually look like? The SaaS churn rate benchmarks for 2026 tell a nuanced story depending on who you sell to.
According to the 2025 Recurly Churn Report, the B2B SaaS average monthly churn sits at 3.5%, with top performers below 2%. At 2% monthly, the average customer lifetime is ~50 months. At 5%, it collapses to 20.
- Enterprise SaaS: 0.5–1% monthly – longer contracts and deeper integrations create stickiness.
- SMB/self-serve: 3–7% monthly – acceptable only if expansion revenue outpaces logo losses.
- Involuntary churn accounts for up to 48% of all churn (Recurly 2025). Smart dunning recaptures 50–80% of failed payments with no product changes. Preventing chargebacks and proactive billing communication sit in the same bucket.
Teams using AI-driven early-warning systems consistently reduce churn faster than reactive ones. Catching a risk signal three weeks before cancellation is very different from finding out the day they leave.
How AI is redefining SaaS retention in 2026
AI has moved from "nice-to-have" to core retention infrastructure. Three mechanisms move the benchmarks:
- Early risk detection reduces churn. Predictive health scoring flags at-risk accounts weeks before human review would catch them. Teams report churn reductions of 2-3 points monthly.
- Scalable personalization lifts user retention. Behaviour-triggered nudges at activation milestones and renewal windows raise feature adoption without manual segmentation. You can't hire your way to this at scale.
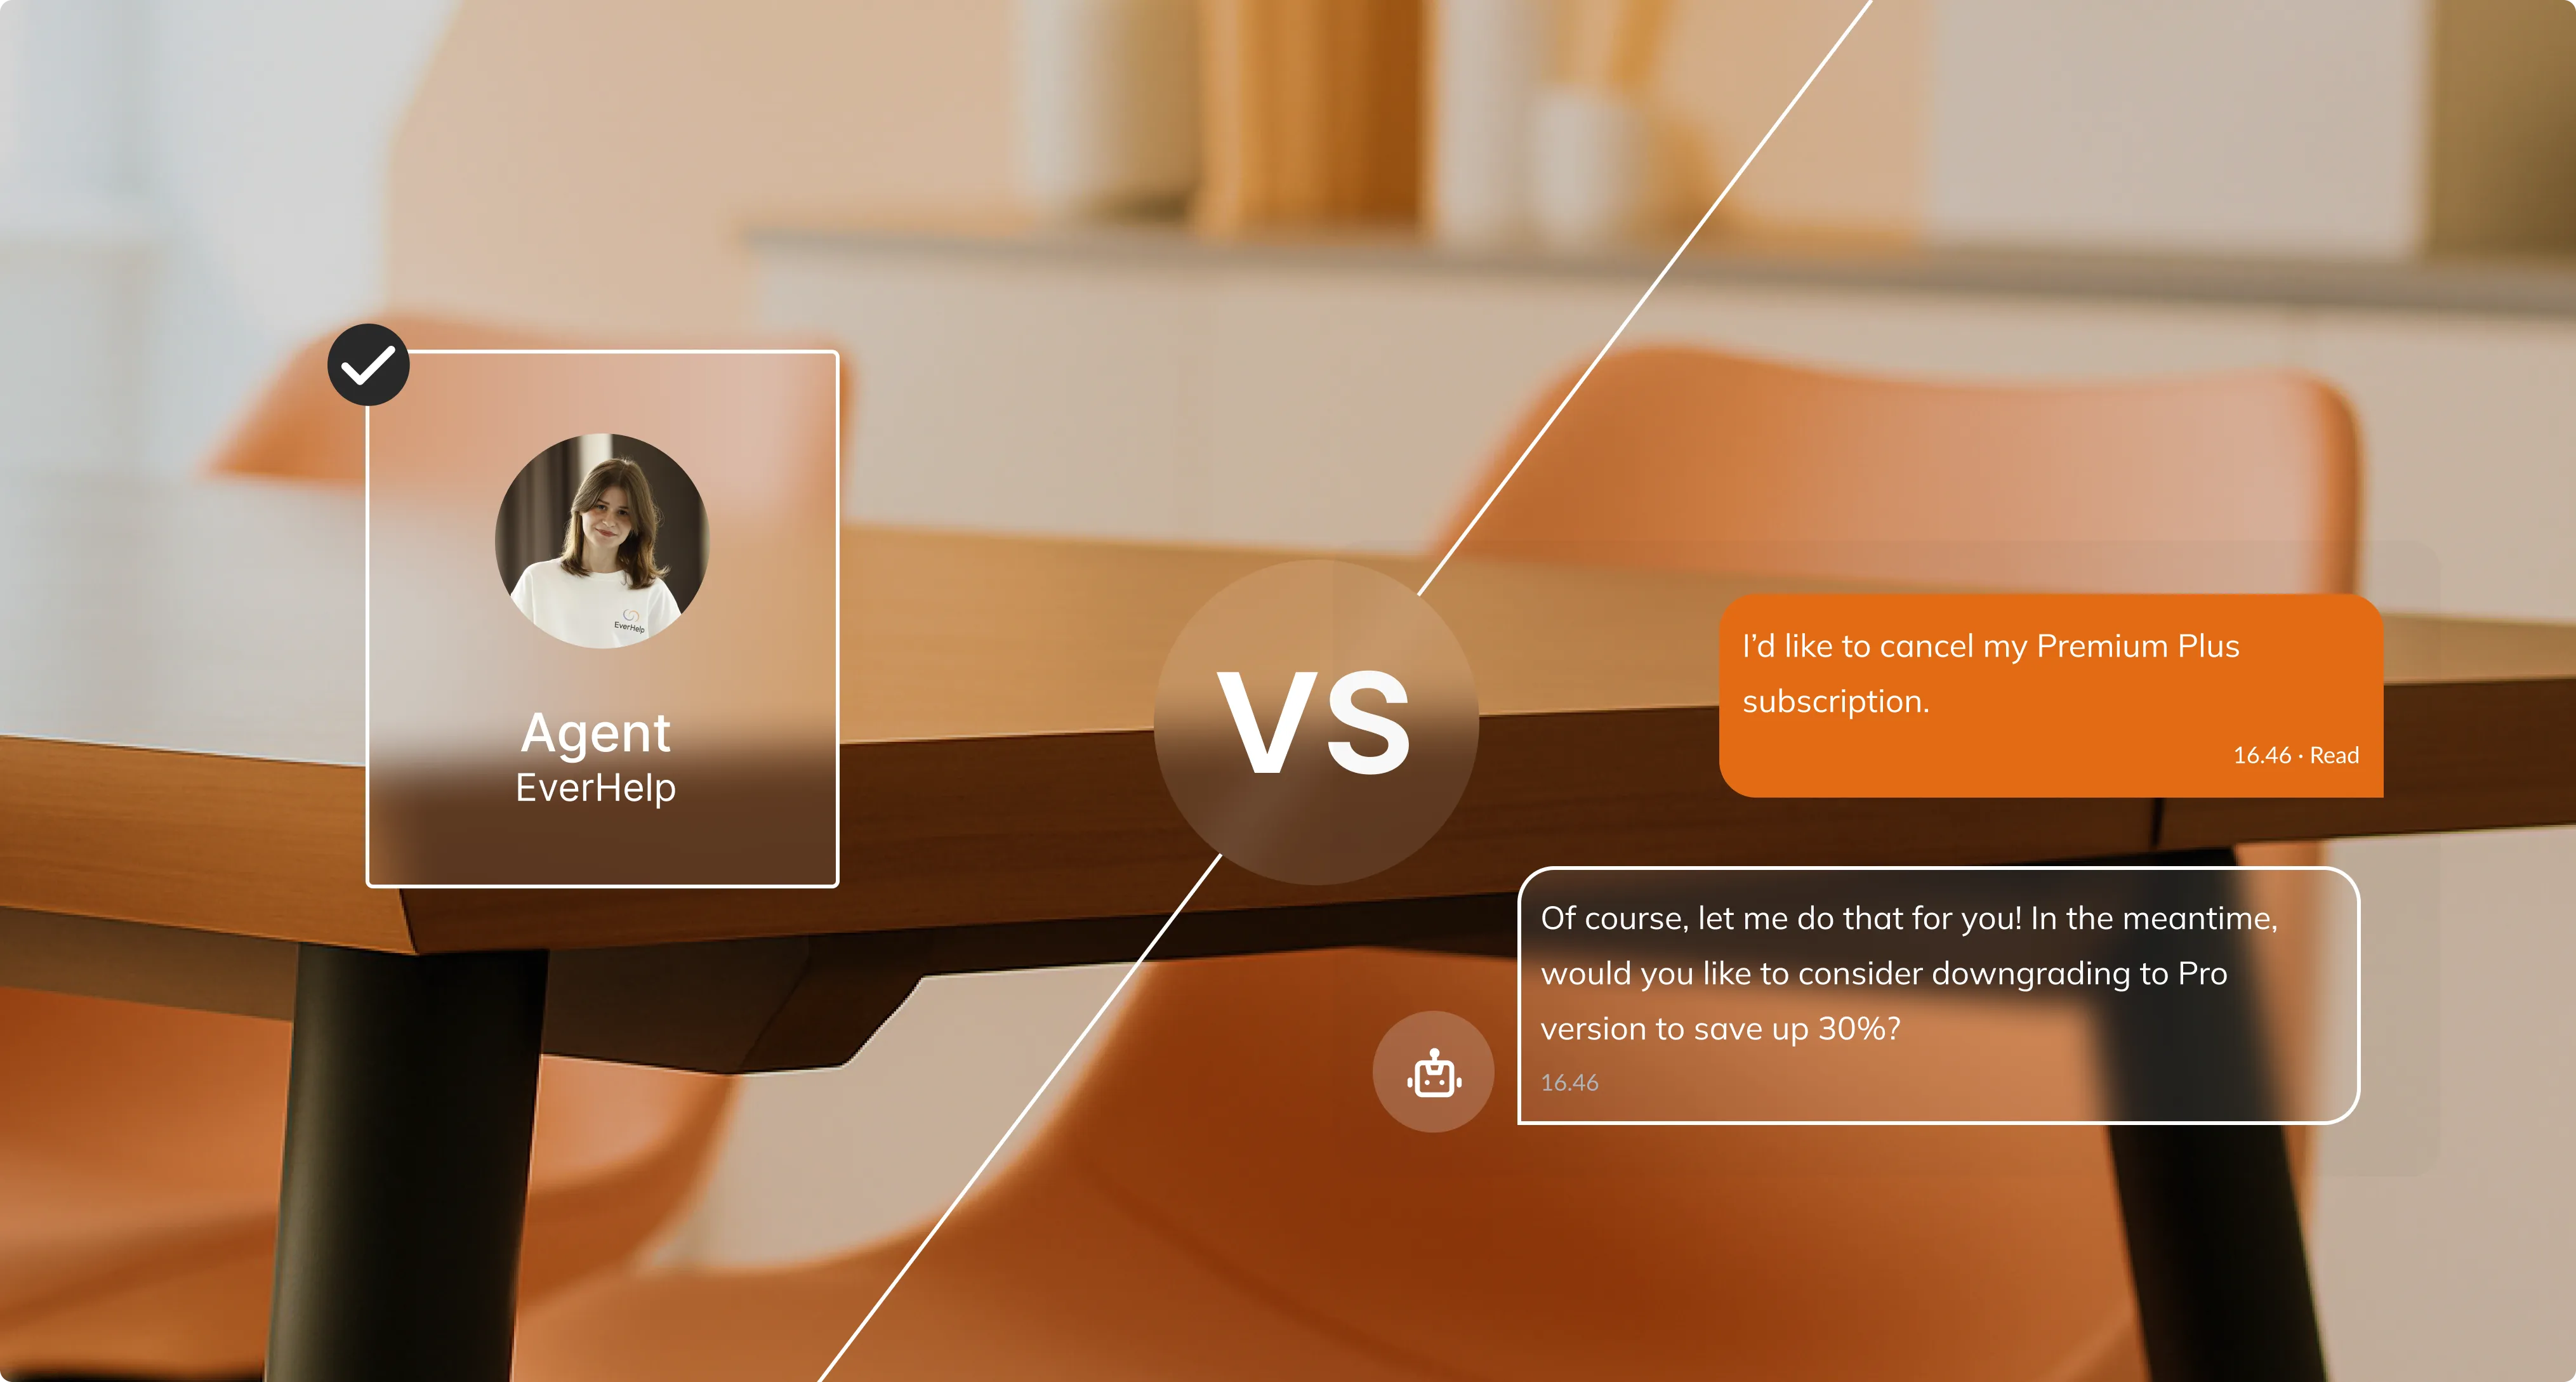
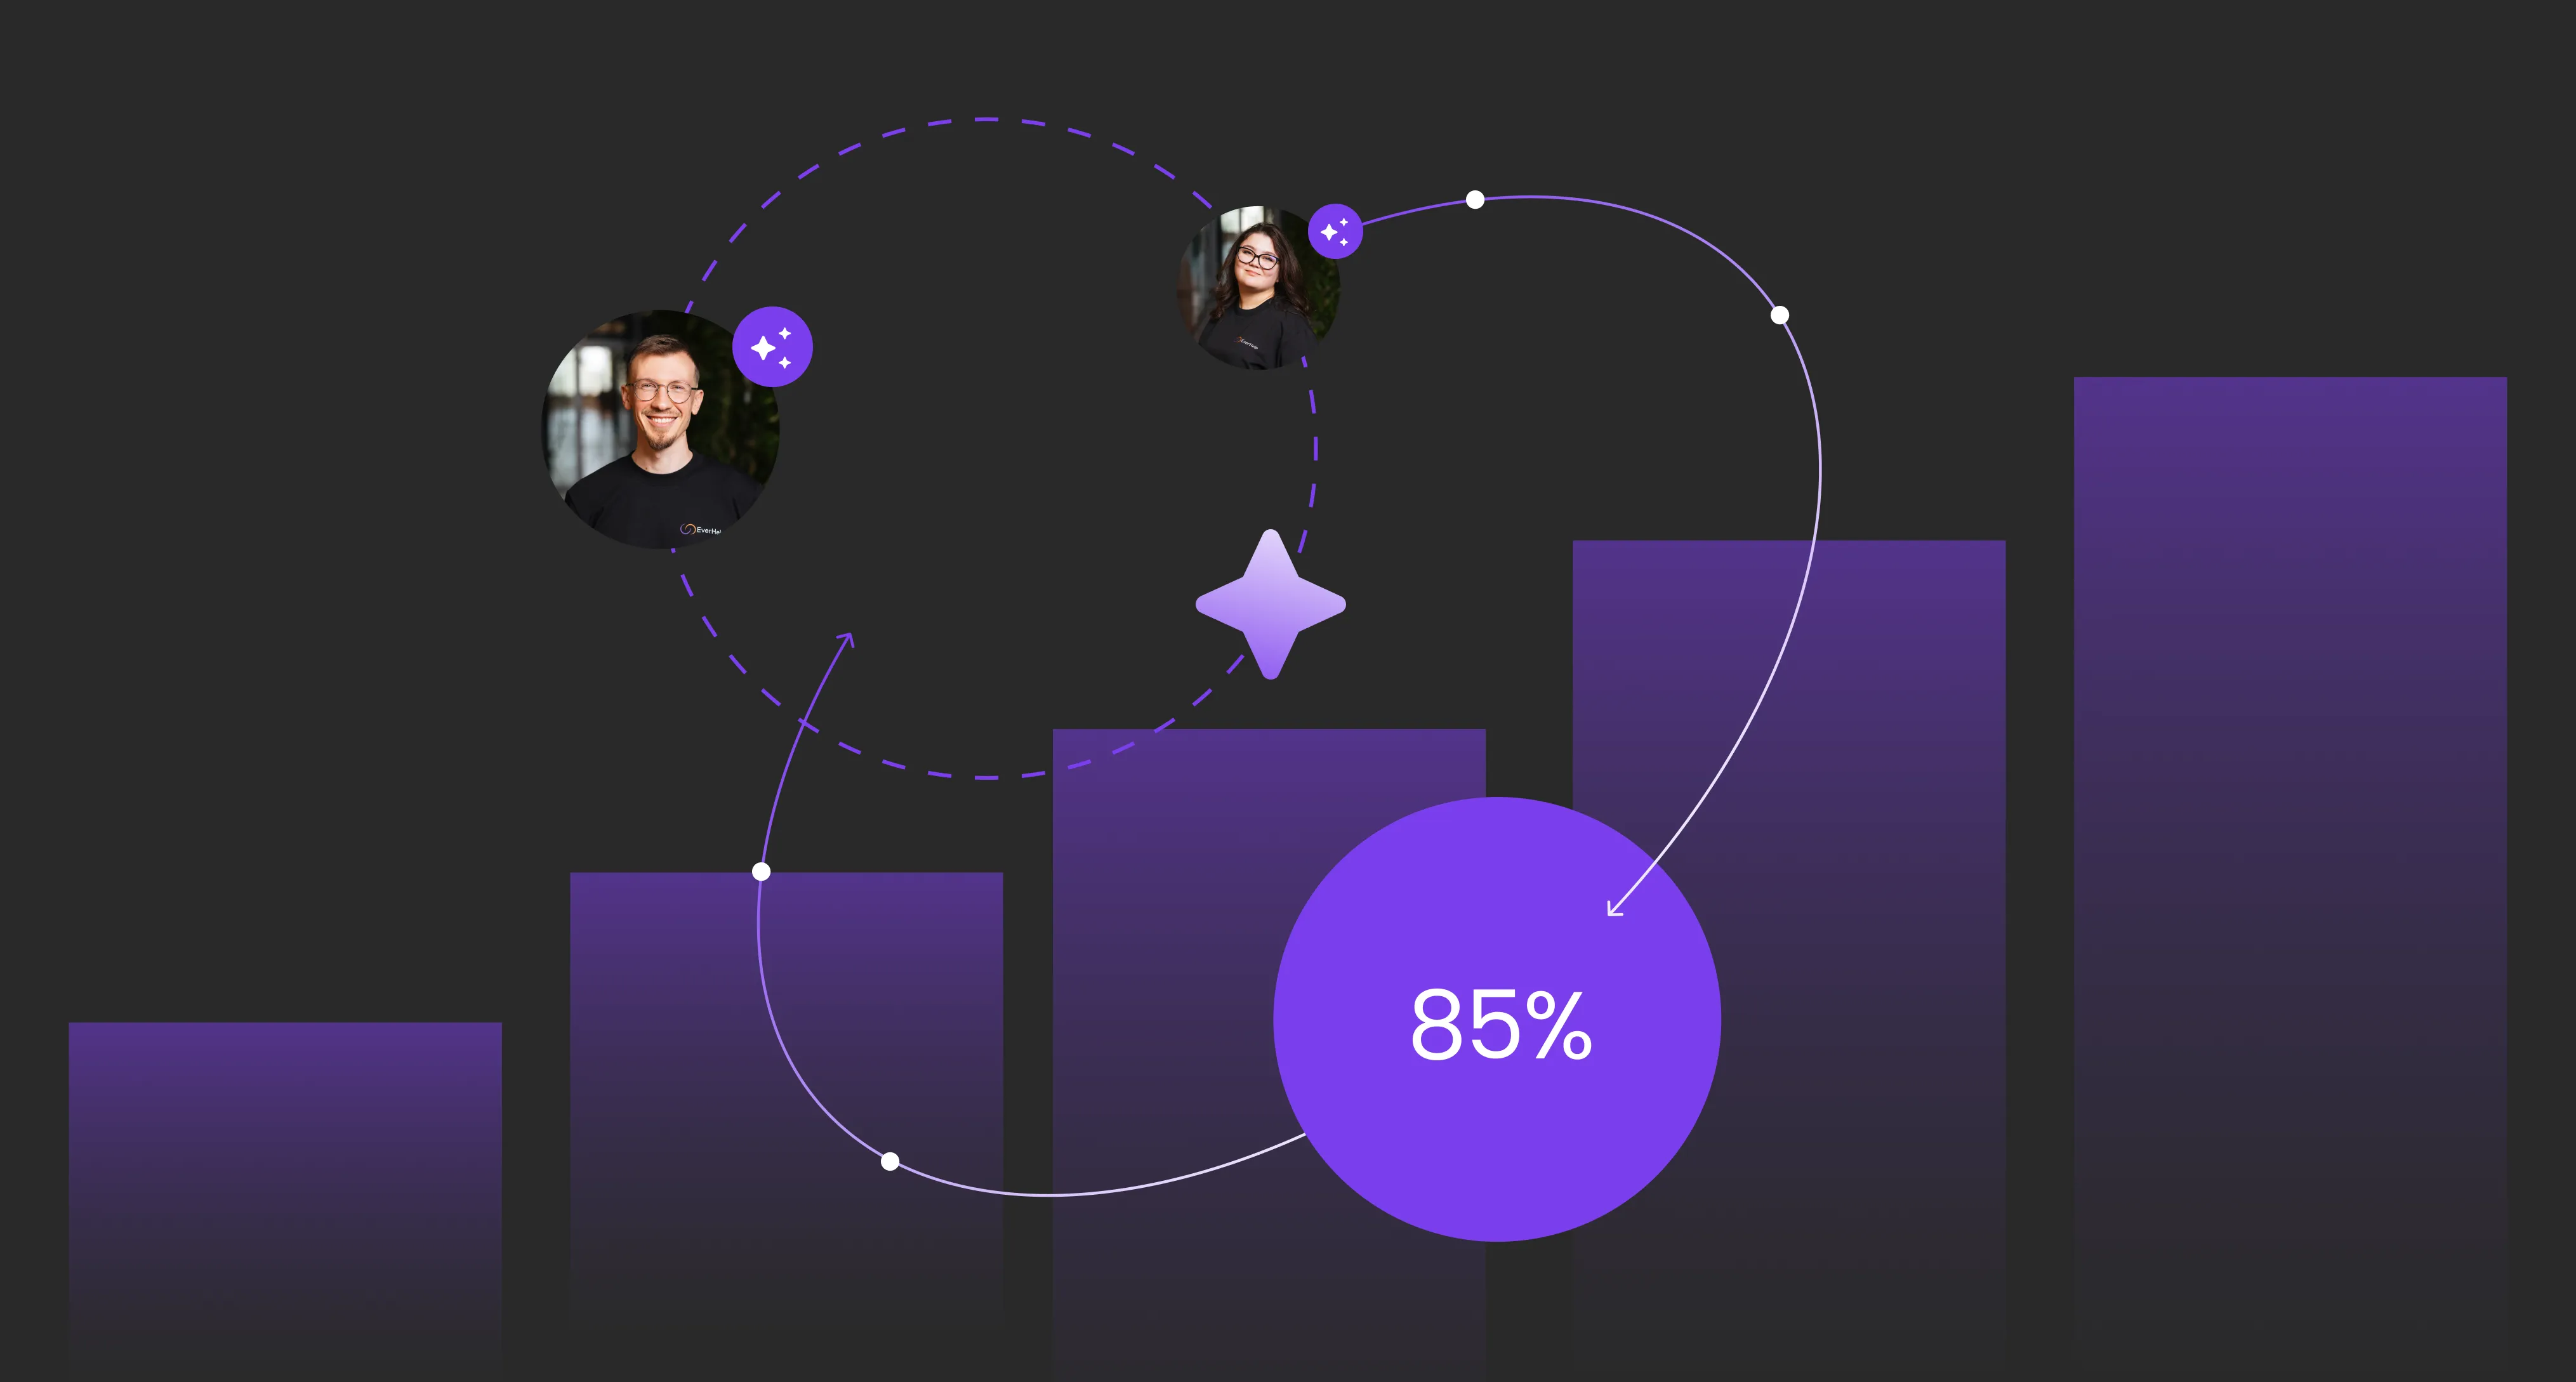
- Faster support improves CSAT and NPS – which correlates directly with renewals. EverHelp's AI agent Evly, trained on 100,000+ support tickets, achieves a 64% CSAT score versus a 47.6% human baseline. Tracking the right customer satisfaction metrics alongside retention keeps cancellation rates in check.
Case study: how AI-driven support saved an app giant
The client: Headway
Headway is the world's most downloaded book summary app, operating in one of the most competitive mobile subscription categories where early drop-off is the norm.
When Headway partnered with EverHelp, the core challenge was to support quality and speed at scale. High volumes of subscription, billing, and onboarding queries were creating early friction – driving disengagement before users experienced full product value. EverHelp deployed a combined human-and-AI support operation across three areas:
- Onboarding support: Faster, contextual answers during the critical first 30 days.
- Billing and subscription handling: Reducing payment friction to minimize involuntary churn.
- Proactive engagement: Reaching users showing early disengagement signals before the cancellation window.
The result: measurable improvement in user satisfaction and a reduction in support-driven churn that had been suppressing renewal rates. See the full case study on our website.
How to audit and improve your SaaS retention in 2026
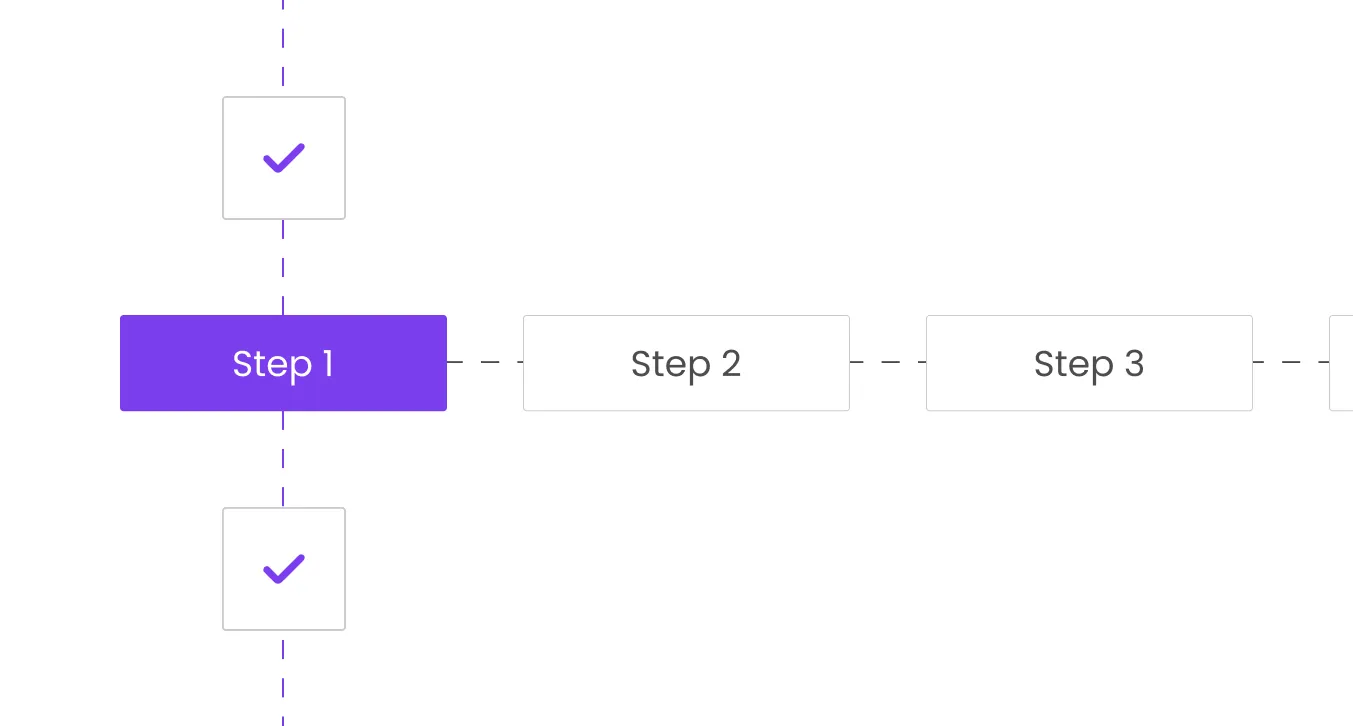
Here's how to turn the benchmarks above into a practical action plan: five steps covering measurement, benchmarking, breakpoint analysis, intervention design, and iteration.
Step-by-step retention audit
Step 1 – Measure your core metrics
Calculate CRR, GRR, NRR, monthly churn, and DAU/MAU using the formulas above. Don't skip involuntary churn – most teams underestimate it.
Step 2 – Benchmark against your segment
Compare against the 2026 SaaS retention benchmarks in this guide for enterprise, mid-market, or SMB. Segment context matters more than raw numbers.
Step 3 – Pinpoint journey breakpoints
Find where users drop off: onboarding friction, feature adoption cliffs, renewal friction.
Step 4 – Design AI-assisted interventions
Triggered support flows, predictive churn alerts, and personalized in-app education move metrics fastest.
Step 5 – Instrument and iterate
Monitor uplift in user retention, churn, and NRR every 30–90 days.
Retention audit checklist
Use this alongside your SaaS customer support guide to check each area:
Table Retention audit
If this audit reveals gaps, that's exactly where proactive customer service and EverHelp's AI-driven support deliver the highest ROI.
Conclusion: turning benchmarks into a user retention advantage
SaaS retention benchmarks in 2026 are a roadmap for profitable growth. Track the right things (CRR, GRR, NRR, churn, DAU/MAU), act on early signals, and close the gap before it compounds. AI-driven, user-centric support is quickly becoming the differentiator between average and top-quartile user retention SaaS performance because customer loyalty is earned at every touchpoint, from first login to renewal.
If your numbers are below the SaaS retention benchmarks in this guide, start with one AI-powered support experiment. Check our SaaS retention strategies and SaaS customer support tips to build your playbook today.
{{cta}}
FAQ
EverHelp's AI agent Evly monitors usage and support signals in real time to catch at-risk users before they reach the cancellation window. Early churn detection lowers monthly churn, onboarding nudges lift 1-month and 3-month user retention, and faster resolution pushes CSAT to 64% – above the 47.6% human baseline.
The median annual customer retention for B2B SaaS is 88–90% — that's the floor, not the target. Top-quartile benchmarks to aim for:
- CRR: 90%+ annually
- GRR: 92%+
- NRR: 120%+
- Monthly churn: Under 2% for mid-market; under 1% for enterprise
Because it's the only number that shows whether your business can grow without constantly acquiring new customers. An NRR above 100% means existing customers generate more revenue than you're losing to churn. Below 100%, new logos are just replacing what's leaving, making it a direct proxy for product-market fit and pricing power.
- Early risk detection: Health scores flag at-risk accounts weeks before cancellation.
- Behaviour-triggered nudges: Personalized prompts raise DAU/MAU and feature adoption without manual segmentation.
- Faster support resolution: Real-time AI improves CSAT and NPS scores that correlate directly with renewals.
Teams with AI-driven systems report monthly churn reductions of 2–3 percentage points – enough to shift from median to top-quartile performance.
- SMB/self-serve: 3–7% monthly
- Mid-market: 1–3% monthly
- Enterprise: 0.5–1% monthly
Top performers push below 2% monthly. Nearly half of all churn is involuntary billing recovery is one of the fastest wins available.


Help someone else stay in the know. Hit that share button!


%20(1).png)
.png)

.png)
.webp)


.webp)

%20(1).png)


.webp)
.webp)
%20Rate%20Smartly.webp)
.webp)

.webp)


.webp)
.webp)
.webp)