


90 Customer service statistics for 2026 (+ those everyone skips)


Most statistics on customer service you'll find recycled across articles are the same five numbers – CSAT, FRT, AHT, refund, and churn rates. You've seen them: "86% of customers will pay more for a better experience." Fine. But pay more for what, exactly? In which industry? Through which channel?
Despite looking authoritative, that kind of data doesn’t really tell you anything about what to fix.
In the meantime, SaaS, Fintech, Hospitality, Travel, and eCommerce support benchmarks stay important indicators of your customer experience and overall business health. As the Quatrics XM Institute has estimated that around $3 trillion in global revenue was at risk from poor customer experience in 2025 alone, we can say with confidence that the case for the importance of customer service statistics is clearer than ever.
In this guide, we wanted to take a different approach to discussing familiar numbers. Thus, we will cover what CX teams actually benchmark against:
- Response time gaps across channels
- Agent burnout & turnover rates as black sheep of statistics on customer service
- Where AI adoption and AI trust diverge (they often don't go hand-in-hand),
- Industry-specific CSAT comparisons
- CES as an unobvious loyalty signal
- And B2B data that looks nothing like its B2C counterpart.
What the big numbers actually tell you
What every year’s report on customer expectations proves is that the anticipation of great service grows and blends over time. Every frictionless interaction a person has with any brand recalibrates what they'll tolerate elsewhere. The company that nails same-day resolution trains your customers to expect same-day resolution from you, even if you've never advertised it.
Now, according to Salesforce:
- 82% of service professionals agree that customer expectations are higher than ever, though "higher" undersells it.
- In the meantime, delivering poor service can cost your business its whole audience, as 99% of consumers rate customer service as an important factor in brand choice, while 74% call it "very important or essential."
We have discussed this many times before, and it hasn’t changed: having an excellent customer service framework is neither a business function nor a luxury. It’s a baseline that, for many buyers, influences decision-making.
And with AI integrating into the industry, the pressure of expectations is even higher:
- 40% of customers say AI raises the bar for the overall CX level they expect from every brand (Salesforce), meaning a fast, accurate AI interaction with a competitor sets the bar higher for everyone else.
- Still, 89% of professionals say that positive service requires a balance among automation, AI, and the human touch.
That’s exactly why we need to take a closer look at our support dashboards before jumping to any major customer-journey-altering decisions. And of course, you need to know what to look for.
Response time benchmarks by channel
Speed isn't everything in support, but it's the first thing customers notice when it's missing. The channel-by-channel data below show that the widest gap between expectations and deliverables is not where most teams would focus their efforts.
Response time expectations vs. industry averages by channel
Source: https://converzation.com/article/statistics/ticket-resolution-statistics/
You probably noticed that for most channels, there’s a gap between when customers expect to receive a response and when they actually do. And the situation with email responses is probably the worst, as not only do most companies fail to meet the under-4-hour response benchmark, but 62% don’t respond to emails at all, which creates a significant loyalty leak.
Because if we think about what bad response times actually cost, it won’t be just your audience’s satisfaction.
- Live chat abandonment rates can reach as high as 50%+
- 28% abandon the product or service entirely after a missed response window
- 88% of customers say good service significantly increases their likelihood of making repeat purchases.
Loyalty, churn, and high refund rates – all of this is a cost of leaving the FRT expectation gap open for your customers. Closing these gaps starts with tracking them. Help desk tools that track FRT by channel are usually the first worthwhile investment, as you can't address a problem you aren't seeing.
Social media customer service statistics
Though social media is becoming increasingly popular, using it as a customer support channel still doesn’t sit right with most businesses. After all, that is a very public channel, which raises the stakes for support personnel to deliver adequate assistance in shorter response windows. But let’s look at what actual numbers say.
- A study by social software provider Lithium found that 53% of clients expect a brand to respond on X/Twitter within 1 hour, rising to 72% for complaints.
- 79% of customers expect a response within 24 hours for their social media posts.
- 13% of dissatisfied customers tell more than 20 people about their bad experience.
Of course, it’s worth noting here that social support is predominantly a B2C channel. B2B buyers default to email, phone, and self-service portals for most issues and rarely treat X or Instagram as a viable escalation path. However, social media remains a great way for building brand awareness, recognition, and loyalty.
Thus, for whatever reason (and audience) you choose to use social media channels, just make sure to adapt your response and communication strategy to reflect your audience's expectations for service quality and speed.
AI customer service statistics: adoption, capability & the trust gap
AI customer service statistics tell two different stories about the state of this technology in the industry. On the one hand, adoption rates are definitely climbing, as the cost of AI resolution allows businesses to save not only agents’ time but also budgets.
At the same time, customers still approach the technology with some caution. They are indeed using the AI chatbots for customer service more often than they were two years ago, but that doesn't mean they're comfortable with it.
What customers actually want from AI
According to the preference provided by SurveyMonkey:
- The overall preference for AI support over humans is just 8%. However, Gen Z customers are more likely to interact with AI (14%) and are also women (60%).
- Most notable reasons for AI use are availability (41%), speed (37%), and accuracy (30%).
- Still, 23% of customers lose trust the moment they feel trapped in an AI loop, and 14% would lose trust if an AI didn't identify itself as a bot.
However, don’t abandon your dreams of implementing an AI customer service agent just yet. Because the takeaway here isn't that customers oppose the technology – it's that they oppose the AI that traps them. And as 95% of consumers expect clear explanations for AI-made decisions, businesses can (and should, if you ask us) implement a specialized solution, just alongside clearer and cleaner escalation paths.
Working with clients, we’ve noticed a certain weariness among customers regarding AI solutions. But that’s exactly why we are huge proponents of the hybrid AI and human support model, through which you can give your audience the best of both worlds. If they need a quick check-up on their order or an answer to a simple question about their account or billing, the AI can give the best responses, provided it has well-structured internal instructions. Yet they still have the option to switch to a human agent if their request is more complex.
Chatbot customer service statistics
Chatbots can still evoke a somewhat rougher response in the audience, as data shows:
- Nearly 40% of chatbot interactions are described as negative, with at least 50% of customers saying they often feel frustrated when dealing with a bot.
- 56% of consumers have had a bad experience with a company's AI features
- 60% of customers feel chatbots fail to understand the nuance of their issue.
Yet some customers would prefer to talk to the bot in certain situations. According to Zendesk's 2026 report, 51% of consumers prefer interacting with bots over humans for immediate answers to simple questions. This once again proves that the best approach is to divide and conquer: leave the more routine and simple tasks to AI while refocusing the agents’ capacity to handle more complex support cases.
{{cta}}
Self-service statistics — the deflection opportunity
If you've paid attention to the recent transformation of grocery stores, you might have noticed that many now offer self-service registers. And this trend is the direct result of the rising interest (or rather, appreciation) in self-service among customers.
In fact, here is what most customer self-service statistics show:
- According to Salesforce, 61% of customers prefer to use self-service for simple issues.
- Microsoft’s State of Customer Service report found that 66% of customers attempt to resolve their issue via self-service before contacting a human agent. For clients aged 18-34, that number jumps to 74%.
The thing about self-service is that, when done well, it can help reduce ticket volume, cut cost per contact, and ensure always-on resolution, all while still maintaining high CSAT. The keyword here is that “done well” part. Unfortunately, to this day, many teams underinvest in creating helpful self-service content. While 80% of high-performing service organizations provide self-service options, only 56% of low-performing organizations do (Salesforce).
So, if your self-service channel isn’t popular with your audience or doesn’t help them resolve issues without contacting agents, we encourage you to review the underlying materials. Do they actually include the information clients need? Is it well-structured and clearly written? And is it easy for your customers to find the said self-service at all? You can also check out the following real self-service examples to guide you through the creation of your own.
Meet the hidden CSAT killers: agent burnout & turnover
Burnout data tends to get filed under HR. It shouldn't. It's a CX problem with a measurable downstream effect on CSAT, escalation rates, and resolution quality. Because burned-out agents handle fewer tickets effectively, escalate more, and score lower on customer satisfaction surveys. The staffing crisis is part of the problem of a poor customer experience.
What is the situation like in the industry? According to Gallup, 76% of employees experience burnout on the job at least sometimes, and 28% say they are burned out 'very often' or 'always' at work, with contact center agents being among the most acutely affected.
Moreover, SQM research shows that:
- 63% of contact center agents experience high burnout.
- 88% of call center professionals agree that burnout is one of the industry's biggest challenges.
We just can’t afford to ignore that high burnout is at least partially behind the average contact center turnover rate of 30–45%, especially when we consider that replacing a single agent can cost anywhere from $10,000 to $35,000 in direct costs alone (if not more).
Run the maths on a 100-agent team at 38% annual turnover: 38 replacements per year, averaging $22K, and you are already spending $836K in direct replacement costs before accounting for the CSAT drag during the six-to-eight-week ramp period for new hires. That’s why sustainable support operations require addressing burnout and turnover in a more structural way than simply backfilling each dropout.
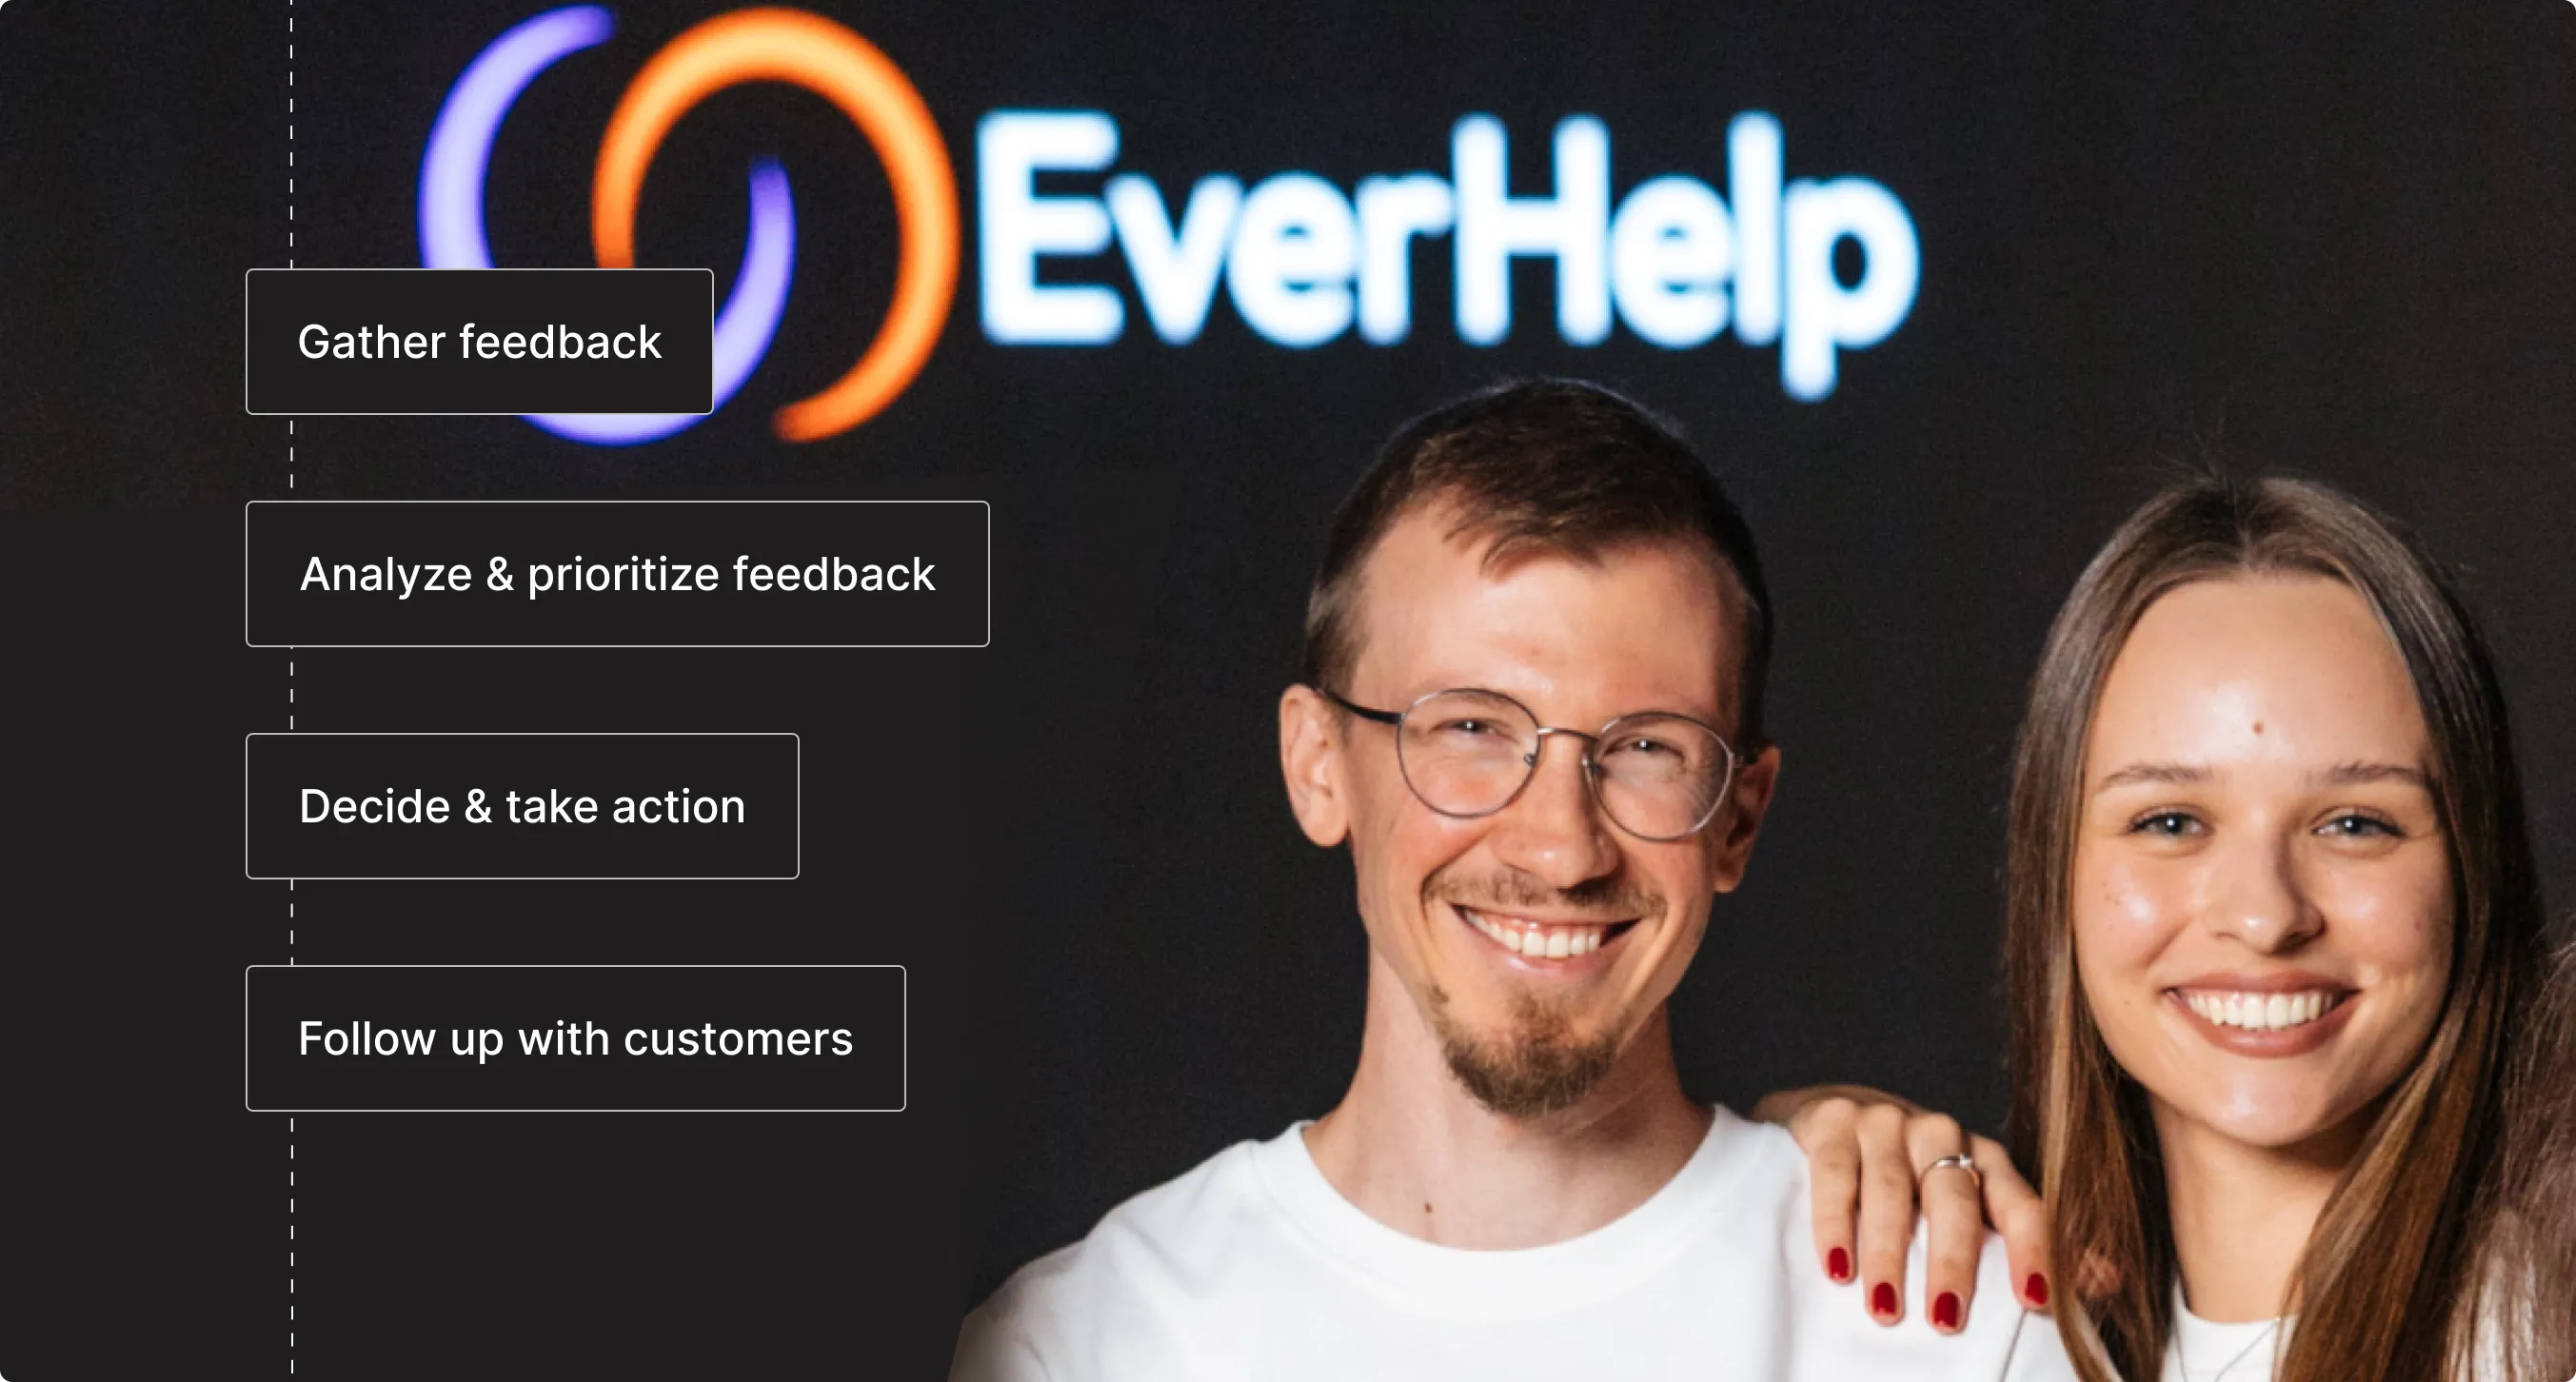
Fixing turnover: the paths to consider
The teams that hold onto agents longest tend to share a few patterns:
- Clearer escalation paths that reduce decision fatigue
- Workload distribution that doesn't leave top performers absorbing the understaffed periods
- Scheduling models that account for the fact that support work – unlike most jobs – has very little built-in natural recovery time.
All that most of these solutions require is someone in leadership to treat agent experience as an operational metric rather than an HR concern.
Using technology to your advantage
Technology can be helpful too. If you have the AI handle tier-one volume, you can reduce the repetitive load that accelerates burnout fastest. But technology won’t fix a fundamentally under-resourced team – it just makes the understaffing slightly more manageable.
Outsourcing support as a solid choice
Another path that, for some reason, stays consistently underused despite its obvious operational benefits is customer service outsourcing. A good outsourcing partner takes full responsibility for the hiring and training cycles, which removes a substantial chunk of turnover cost from the P&L. Still, the less obvious gain is talent continuity, as within the vendor's system, experienced agents stay on the account through seasonal spikes instead of being replaced every few months by someone still learning the product.
Of course, not every partner is the same, and some providers just pass their own attrition costs back through the engagement model, and you end up with the same revolving door problem. But that’s why leading outsourcing providers won’t be afraid to talk about their internal retention rates. For example, we at EverHelp do everything we can to maintain employee retention at 90% or higher, which allows us to provide our clients with knowledgeable agents deeply integrated into their products.
And these efforts pay off both internally, as we maintain a strong team of experts, and externally, as we gain recognition for our people-first culture. Just on May 21, 2026, EverHelp was announced as a #1 Inspiring Workplace in Europe, as we were rated best-in-class across such categories as culture, leadership, wellbeing, including and belonging, employee voice, and experience. It’s an honor to be recognized for our genuine desire to take care of the people we work with.
Customer service outsourcing statistics
This leads us to the next topic of the state of customer service outsourcing in the industry. Despite businesses still working hard to maintain internal support infrastructure, the data show the contact center outsourcing market is growing steadily, as internal scaling is becoming too slow and too costly to keep pace with demand fluctuations.
Here’s how the market is currently looking:
- According to Market.us research, the global call center outsourcing market is projected to grow to USD 259.2 billion by 2034.
- Other findings suggest that almost 78% of companies globally outsource at least some component of their customer support, with the practice being most popular in the financial (72%) and healthcare (65%) fields. However, eCommerce customer service (61%) and tech (58%) support still sit somewhere close.
When it comes to the reasoning, cost reduction remains the key driver; however, back in 2024, only 25% of executives reported reductions in vendor service costs or improvements in service quality.
Still, it’s hard to disprove the claim that outsourcing partners absorb the costs of recruiting, onboarding, and ramp-up, thereby providing their clients with a stable labor supply without the internal overhead. It also seems that the top providers currently operating have significantly improved their services, achieving CSAT of 85-90% and an average FCR rate of 78% (Market.us).
Read more on how outsourcing onboarding works and see if it works for you.
Industry-specific CSAT benchmarks: what is considered "good"?
A CSAT score doesn't exist in a vacuum. And the industry in which you operate largely dictates the expected levels of customer satisfaction for a good business. A 78% in telecom is a competitive differentiator. But as SaaS customer support operates under tighter retention economics than most sectors, if you see the same number for such a product, consider it a retention warning. Below, we will take a closer look at the CSAT benchmarks in different industries.
Discover SaaS-specific retention strategies in the following article.
CSAT benchmarks by sector
The most reliable data available on the CSAT scores across industries is provided by the American Customer Satisfaction Index (ACSI).
The table below draws on ACSI 2024 data alongside SurveySparrow sector reporting.
Retail customer service statistics
In eCommerce, customer experience is everything. Nowadays, as the market is oversaturated with brands, manufacturers, and online sellers, brand reputation is usually the most important factor (aside from price) driving the audience’s decision-making.
To give you a precise picture of the role customer service plays in eCommerce, here’s the current data:
- 73% of consumers say a positive customer service experience is a key factor influencing their brand loyalty in retail.
- 51% of negative experiences result in customers reducing or stopping spending — this jumps to over 60% for fast food and parcel delivery, the two most service-sensitive retail sub-sectors.
- Only 39% of U.S. customers feel retail call center agents are aware of their needs — a perception gap that directly influences brand engagement and repeat purchase intent.
- 93% of customers say online reviews influence their purchasing decisions, meaning poor service that triggers negative reviews, aside from retention loss, also creates a compounding acquisition cost.
Overall, there’s a total of $2.8 trillion of sales at risk due to bad experiences (Qualtrics), which means that for eCommerce companies, a well-functioning customer service is the baseline for a thriving business.
{{cta}}
Measuring CES, the loyalty metric nobody is talking about
Everybody tracks CSAT, as it measures satisfaction in the moment, and NPS, as it reflects brand advocacy. However, fewer businesses consider measuring Customer Effort Score (CES), which tells how hard a customer had to work to get their issue resolved. It's arguably the most actionable loyalty metric available, yet almost no statistics roundup covers it.
The first one to introduce CES was Matt Dixon, who discussed the metric in his 2010 HBR article titled Stop Trying to Delight Your Customers. Since then, numerous studies have been conducted to see how it compares to other satisfaction metrics. And, according to the core finding from Corporate Executive Board (CEB) research, reducing customer effort predicts loyalty 1.8x better than CSAT scores.
Some of the other CEB findings presented by InMoment point further to the importance of measuring and knowing your business's CES:
- 96% of customers who exert high effort in a service interaction are more likely to become disloyal and churn than the 9% whose experience was effortless.
- 94% of customers who experience an effortless interaction are likely to repurchase, vs. only 4% of those who face high effort.
- The cost-to-serve decreases by 37% when moving from high to low effort.
If you decide to start measuring CES via surveys, they are best deployed transactionally, immediately after the interaction closes. Because it’s exactly the timing that makes it a predictive measure, if a customer called back twice before their issue was resolved, CSAT might still score as acceptable if the final agent was polite. CES won't. It catches operational friction that satisfaction scores routinely miss, which is precisely why it's a better loyalty signal.
The difference between B2B vs. B2C customer service statistics
Losing a B2C customer is a transaction. Losing a B2B customer means losing a multi-year contract, a sunk implementation cost, and a referral network. The two aren't comparable, yet both depend on good customer service to be successful.
- 82% of B2B corporate buyers expect the same experience as B2C; only 27% feel companies deliver it.
- Salesforce research also shows that two-thirds of B2B customers are switching suppliers to get B2C-level service.
- 80% of frequent B2B buyers report having switched suppliers at least once within 24 months because suppliers were unable to meet buyer expectations.
- At the same time, B2B buyers tolerate slightly longer response windows due to complexity, but leads contacted within 5 minutes are 21x more likely to qualify than those contacted after 30 minutes.
Regarding customer satisfaction, while 88% of organizations use CSAT as a primary success metric, only 49% of B2B firms treat it as a core CX measure. The thing is, in B2B, it’s account retention, net revenue retention, and time-to-value that actually predict contract renewal. Because longer relationships have a higher tolerance threshold, but also much larger contract values.
Channel preferences also diverge sharply from B2C. B2B buyers default to email, phone, and dedicated self-service portals. They rarely use social media for support escalation and typically expect account-level contacts, SLA-backed response times, and defined escalation paths as standard.
Reviewing B2B CX outsourcing models can clarify which support structures fit high-value B2B relationships versus high-volume B2C accounts.
The use of customer service tools: roi statistics in B2B
Because of its specifics, B2B is the field where using digital customer service tools would be especially helpful, as the returns on such use are well documented.
Companies investing in AI-powered customer service, for example, average $3.50 for every $1 spent, with top performers reaching 8x ROI. Aside from that:
- AI reduces peak-season staffing needs by up to 68%
- Agents using AI handle 13.8% more inquiries per hour
- And organizations that prioritize CX see costs fall 20–30% while revenue grows by 10–15%.
And you can only see these gains as all of the variables build on top of each other. Faster resolution improves satisfaction. Better satisfaction improves retention. Better retention raises lifetime value, which, in B2B, where contract values are large and referral networks are real, matters considerably more than in B2C. And when AI-powered systems are properly implemented, they can show up to 31.5% improvements in satisfaction metrics and 24.8% improvements in retention.
But without baseline metrics, you can't quantify any of it. For a full breakdown of where the gains come from – and a free calculator to model your own numbers – read the complete ROI framework here.
Getting it right: the cost of poor customer service
By this point, we have presented several figures showing how poor service affects your business. The response time gaps that slowly but surely drive abandonment, the burnout rates that drag down resolution quality, the chatbot frustration that diminishes trust more than it builds convenience, and the B2B contract values lost to service experiences that don't meet expectations.
Qualtrics XM Institute puts $3 trillion in global revenue at risk from poor CX in 2025. The U.S. portion alone accounts for $865 billion in halted spending – money customers chose not to spend, not because of the failed product, but because of the failed service experience.
And as 70% of customers will abandon a brand after just two bad experiences, the economics of losing your audience become worse than most teams are ready to account for.
Pro tip: Most teams track satisfaction after an interaction closes, even though by the time a customer has logged their second negative experience, the retention window is already too narrow. The teams with the lowest churn rates tend to flag the first bad interaction, not the second.
You could first start by setting:
→ CSAT score below a set threshold;
→ Ticket that required three or more contacts to resolve;
→ Or an escalated conversation.
These triggers should automatically queue a proactive outreach from a senior agent or account manager. But it should be an actual follow-up, not simply a survey or questionnaire.
Considering that 80% of future profits come from 20% of existing customers, you can see that a disproportionately large revenue concentration simply exists inside your current customer base. And that the best way to extract that revenue is to treat that audience right (read: how they expect to be treated).
The data shows a direction — does your operation follow it?
All the presented customer service statistics essentially point to the same pattern: the teams winning in customer support are simply those that respond faster, resolve tickets with less friction, and deploy the right mix of human and automated support for each channel and audience type.
But to reach that state, businesses should move beyond simple surface-level fixes, such as hiring more agents or opening another support channel. Support operations require a more structured approach to improvement, focused on:
- building clearer resolution flows
- introducing more structured processes
- and implementing automation where possible.
If any section of this guide reminded you of a gap in your current operation, you have solid grounds to launch optimization efforts. And even if you still feel lost about what exactly isn’t working, you can talk to our team, and we can help you discuss possible levers to improve your support.


Help someone else stay in the know. Hit that share button!


.webp)


.webp)

%20(1).png)


.webp)
.webp)
%20Rate%20Smartly.webp)

.webp)


.webp)


.webp)
.webp)

.webp)