Growth & Metrics
Published on
14.07.2026
Last updated on
01.09.2026
CSAT vs NPS vs CES: Which metric should you actually track?

Valentyna
VP of Customer Support

Valentyna
VP of Customer Support
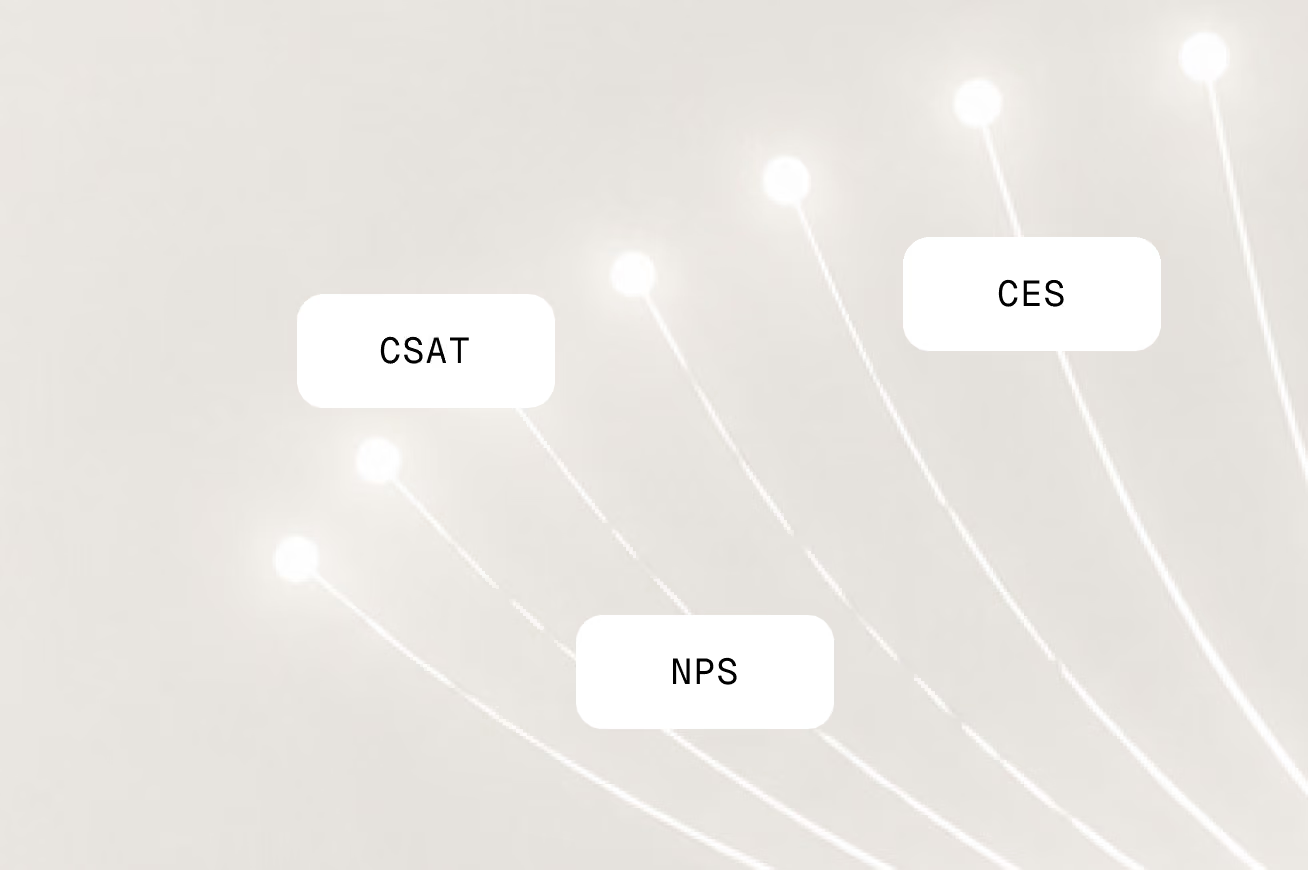
Most CX teams know how to work with customer service analytics to track performance and generate comprehensive quarterly reports that reflect the actual audience’s satisfaction and behavior. Yet not all specialists understand the interrelationships among the metrics they monitor, especially for customer service metrics like CSAT, NPS, and CES.
We know that most of you are familiar with the acronyms and how to track them, so the focus of the following guide is to outline which scores should actually drive the decision-making process and under what circumstances.
Because we understand that continuously misaligning performance and strategy can be costly, American companies have spent over $100 billion on CX since 2013, with nothing measurable to show for it, much of that poured into tracking everything and acting on almost none of it.
What we want to show in this NPS vs CSAT vs CES comparison is that none is more important than the others. The one worth your attention comes down to what you're trying to learn, which is really the job of any decent set of customer satisfaction metrics.
It’s easy to lump these three most popular CX scores together, since each:
People especially conflate CSAT and NPS, but each one represents a different stage of the customer journey. And if you want your business to have a serious voice of the customer program, you need to understand this difference up front.
Of course, all three scores belong in a mature CX program. However, following such a program, one would also interpret the metrics in light of the current business question. After going through the sections below, that type of prioritization should be clear.
{{cta}}
CSAT is the customer satisfaction score most teams track first because it's fast, cheap, and easy to read. It shows exactly how a single interaction felt for your customers, right after it happened, before memory fades or context shifts.
CSAT asks one thing: "How satisfied were you with [X]?" Respondents answer on a 1–5 or 1–10 scale, and you usually send the survey the moment an interaction closes via email, chat, or IVR.
The CSAT formula can be tricky to grasp, since it doesn't rely on an average. So here's how to calculate CSAT correctly:
So:
CSAT % = (positive responses ÷ total responses) × 100.
It's basically your share of happy customers, rather than their mean. That distinction matters when you're building customer service KPI examples for a report, because an average won’t show those customers who scored you a 2.
What it represents: CSAT is best for touchpoint-level data.
Questions it answers:
Benchmarks:
Ideal use case: It works especially well for agent-level QA in outsourced support, since you can tie a score directly to an individual or a queue. That makes it easy to spot which approaches constitute excellent customer service examples to replicate and where to focus as you figure out how to improve customer service standards.
CSAT is reactive and moment-specific. A customer can rate a ticket 5/5 and churn the following month because the survey measured a single interaction, but not the relationship.
Being satisfied in the moment doesn't mean being loyal over time, and that gap is the main reason CSAT can't be used as a standalone basis for retention or revenue forecasting. It tells you how your service performed, and not whether the customers will stay, and that’s why all the CSAT vs NPS comparisons don’t really hold up.
Note: That’s also exactly why CSAT won't tell you much about how your team is handling difficult customer interactions. If the case ended politely, the customer will rate the ticket well because the agent was courteous. Yet, the underlying frustration that will eventually push them out goes completely unrecorded.
If CSAT zooms in on a single moment, NPS pulls back to look at the whole relationship. For this exact reason, it is also best to track alongside the more standard SaaS retention benchmarks your finance team keeps an eye on.
NPS answers a single question: "How likely are you to recommend us?" on a 0–10 scale. From there, respondents fall into three groups:
To calculate the score, use the formula:
NPS score range from −100 to +100 = % promoters − % detractors.
What is a good NPS score inside that range depends heavily on your industry, which we cover next.
What it represents: NPS best reflects the health of the relationship at the account level. Thus, it should be used to guide your business’s customer retention strategies.
Questions it answers:
Benchmarks:
For B2B and B2C SaaS companies, the net promoter score benchmarks the following way:
However, these numbers vary by sector, so weigh yourself against your own industry rather than an absolute target.
Ideal use case: account-level monitoring, renewal risk flagging, and strategic decision-making about retention.
Note: American national customer satisfaction slipped to 76.7 in Q1 2026, with complaints up 16%, and yet retention actually held because high switching costs kept frustrated customers from leaving. That's the pent-up churn NPS is meant to monitor.
NPS is good at telling you something's wrong when detractors start climbing, but it rarely tells you what or where. It's a lagging indicator, so by the time the number dips, the tension between your customers and business has been building for a while. Since, on its own, NPS is rather weak at customer churn prediction, you will need to additionally track CSAT or CES to be able to take any useful actions. That's the other side of the CSAT vs NPS trade-off.
Note: Around 49% of NPS users also track a second metric, most often CSAT. So, in practice, NPS tends to be the anchor, while the other scores layer in for detail.
{{cta-lm}}
CES is the most underused of the three, and arguably the most predictive. It basically measures how hard your customer had to work to get what they came for. And according to Gartner’s research, 96% of customers who go through a high-effort interaction become disloyal, compared with just 9% of those with a low-effort one. So if effort is your issue, this is the metric that finds it.
CES provides an answer to the question "How easy was it to resolve your issue today?" Usually, it’s measured on a 1–7 Likert scale, though some teams report it as a percentage of positive responses. You either average all the responses or count the share who rated 5–7 as positive to land on your CES score.
This survey needs to be sent out as close to resolution as possible, ideally within minutes of closing the ticket, which is much easier when your support channels are set up to trigger surveys on their own.
What it represents: CES indicates whether your support process itself is pushing customers away. Not whether the agent was friendly, but whether resolving the issue took too many steps, transfers, or repeat contacts.
Questions it answers:
Benchmarks: A general practice is to aim for above 5.0 on the 1–7 scale, or above 80% on a percentage basis.
Ideal use case: high-volume support where you suspect friction, not sentiment, to be the reason people leave.
This is also where you'll see the impact of your support channel choices, as it can clearly show whether live chat vs chatbot is easier to use for your audience.
Note: CES is x1.8 more predictive of loyalty than CSAT and x2 more predictive than NPS, because effort is what actually drives future behavior, while satisfaction and advocacy are mostly what people say after the fact. As such, it is one of the metrics that is necessary to build your digital customer experience strategy.
CES is purely operational, so it won't capture emotion, sentiment, or the wider relationship. A customer can breeze through a low-effort ticket and still leave over pricing or a competitor's more versatile offering. It also lacks standardized cross-industry benchmarks, which makes it harder to compare yourself against rivals than NPS.
Of course, you don't need to track all three at the same time. There's no universal winner in the NPS vs CSAT vs CES debate anyway. As each of these requires customers to fill out surveys, sending them out one by one (even if in different scenarios) will just cause more frustration.
So, when deciding whether to focus on CSAT vs NPS vs CES, pick the one that answers your most pressing question, run it properly, and you'll already be ahead of the teams juggling three dashboards and acting on none of them.
Here’s a quick guide on how to choose a metric based on your focus:
Of course, you can run all three, and most mature programs eventually do. The trick is that each metric must be collected at its own time and reviewed on its own schedule. Otherwise, you risk ending with three dashboards that contradict each other and that nobody trusts.
Here's a cadence we've found to work:
Having a customer feedback system built this way, you can use metrics to build on each other.
Example: A high CES on tickets tends to predict a decline in CSAT, which in turn predicts a decline in NPS. Tracking CSAT and NPS together, then, shows you how far a friction problem has influenced your other customer touchpoints.
So if you watch the leading indicators (CES and CSAT), you protect the lagging one (NPS) and gain a proper understanding of customer needs instead of hypotheticals.
{{cta}}
As an outsourced customer service provider, we see all three turn up in client SLAs, though each plays a different role once it's written into the contract.
These metrics can also be used to regulate your vendor-client relationship. Since CSAT and CES fall within the support team’s span of control, it's fair to attach them to bonus or penalty clauses.
NPS, on the other hand, is more of a shared diagnostic that should be reserved for QBR discussions. Because a customer can score you low over a price hike, a missing feature, or a billing dispute that the support agents were never part of, NPS is an unfair metric to include in vendor scorecards.
Different customer satisfaction metrics should trigger different responses from respective teams. In our practice, the standard is the following:
One important thing to establish before even launching support outsourcing is exactly how you, as a client, want the metrics measured. So, in the contract, define the appropriate ranges and benchmarks, as well as the desired measurement windows.
Remember, the metrics that help you are the ones tied to the decision in front of you. Thus:
If you'd rather not build all that measurement machinery in-house, our SaaS customer support team can run these metrics to spec from day one. Just book a meeting with our experts and find out together what to focus on next.
Help someone else stay in the know. Hit that share button!




.webp)

.avif)
.avif)