Growth & Metrics
Published on
21.07.2026
Last updated on
01.09.2026
Customer Satisfaction Metrics: 7 That Actually Drive Decisions (2026)

Nataliia
Chief Executive Officer

Nataliia
Chief Executive Officer
According to ACSI, just in the first quarter of 2026, U.S. customer satisfaction slipped again, falling to 76.7 on the ACSI's 100-point scale while complaints jumped 16%. Yeti, retention rose at the same time. And though it may seem like a win, in reality, it signals that customers are staying while getting angrier.
The ACSI calls this pent-up defection: churn that hasn't happened yet, sitting on your books like an unpaid invoice. If your dashboard shows steady retention right now, it neither means your customers are satisfied nor that your service is up to their customer service standards.
So the practical question isn't whether to track customer satisfaction metrics. It's which ones actually reflect the voice of the customer, predict what they will do next, and how to read them together instead of one at a time. This guide covers the 7 that earn their place on a support dashboard in 2026, and discusses:
As customer service statistics for 2026 show that 70% of consumers are ready to drop a brand just after 2 bad interactions, we believe it’s important for companies to know what can help them act proactively.
Before we go deeper into the different KPIs, it's worth giving an answer to two questions:
Satisfaction is both cognitive (was the product right, was the answer clear) and emotional (was the process easy, did the agent seem to care). Customer satisfaction metrics turn those feelings into numbers you can act on.
There are two ways to gather that signal, and mature teams use both.
Direct metrics tell you how customers feel. Indirect metrics tell you what they do. And survey scores and actual behavior don't always agree. A customer can rate a chat 5/5 and still cancel next month, so what people do is often a more reliable signal than what they report. AI makes the difference look even more stark, since many AI-handled chats are never surveyed.
The practical move is to track a few customer satisfaction KPIs that each drive a clear decision, not every metric you can collect.
“A satisfied customer is the best business strategy of all.”
– Michael LeBoeuf.
First things first, the market for customer satisfaction is huge! According to Mordor Intelligence, the customer experience management market size is $22.79 billion in 2026 and is projected to reach $37.23 billion by 2031, with a 10.31% CAGR over the forecast period.
Why is this industry so popular? Positive customer experience and success are at the heart of any entrepreneurship, large or small. And connecting the business goals with customer success KPIs can ensure both quality service and growth.
Note: A happy customer is not only the one who comes back but also the one who recommends your business to friends, colleagues, and acquaintances.
Recent data from BrightLocal shows 97% of consumers read reviews of local businesses, and 41% always do so. Moreover, most of them find that a consistent sentiment across multiple reviews is the key deciding factor. So, whether you want it or not, creating positive support and a general buyer experience for your customers is a sure way to push your business forward.
Don’t know which metrics to start with? Our outsourced customer service is ready to help you outline your targets and keep them up to standard without the hiring lift.
So, what are these almighty metrics? In this part, we’ll discuss the 7 most common KPIs and their step-by-step calculations, provide examples of success metrics, and describe their possible uses for companies.
We’ve decided to include both qualitative and quantitative methods, as well as combinations of the two, to provide the fullest possible picture.
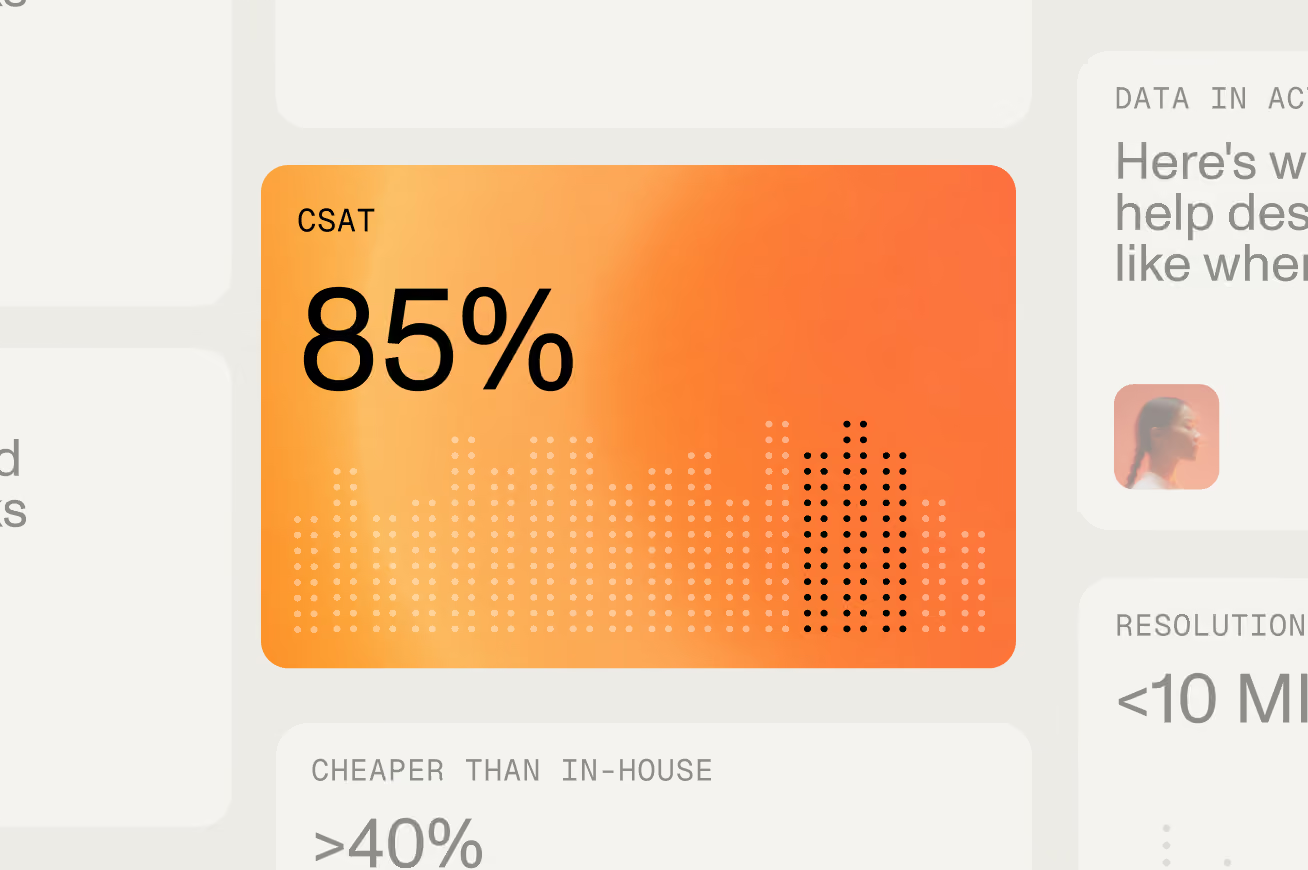
CSAT is a metric that provides direct feedback from customers on how happy they were with a specific interaction, usually right after it happens, on a scale you convert to a percentage. Just remember, CSAT measures satisfaction against expectations, so understanding customer needs sets the bar you're being judged against.
Depending on the industry, a healthy CSAT can be anywhere around 75–85%+. However, a single company-wide CSAT number doesn't tell you much on its own. What helps is segmenting CSAT metrics by:
This will make the weak spots easy to find, because if a billing flow scores 61% while onboarding scores 92%, you know exactly what to fix. Resolution time, repeat-contact rate, and other customer service KPI examples that usually constitute the full CSAT are what you actually work on to improve it.
To establish the CSAT score, ask a single question after a support contact, purchase, or onboarding step: "How satisfied were you?" Count the top responses (typically 4s and 5s on a 5-point scale) as satisfied. If 2,490 of 3,000 chatbot conversations rate positive, your CSAT is 83%.
The formula itself is simple:
CSAT % = (# of positive scores / # of tidal scores) x 100
One thing we want to emphasize is that CSAT is probably one of the easiest metrics to improve. If your team studies the highest-scoring interactions and treats them as excellent customer service examples, they are more likely to raise the average CSAT score than if they focus only on negative sentiment.
This is not to say that hard cases should be of no interest to your team. On the contrary, if you notice customers being largely dissatisfied with their support interactions, you should take it as a sign to take action. And the first thing you can do is create a playbook for handling difficult customer interactions to help your agents immediately recover the profiles with low-end scores.
Net Promoter Score measures the likelihood that customers will recommend the product or service to others. You’ve probably gotten one of these in the past weeks. We certainly did!
Scores run from −100 to 100. Above 30 is generally good, and above 50 is strong, but what matters more is the trend and the questions you ask as follow-ups.
Example: If you have an NPS that holds at 45 while complaints climb, you are probably facing a satisfaction masking risk.
NPS is only helpful if you can use it to close the loop, so pair it with proactive customer service outreach to detractors, to prevent them from churning.
The formula for NPS looks like this:
NPS = total % of promoters - total % of detractors
The promoters are customers who chose the top answers to the questionnaire (9 to 10). These are people who are excited about your product and will be your advocates if a possibility arises. Detractors are those who respond with a score from 0 to 6. They are dissatisfied customers.
Example: Ask your customers, "On a scale of 0 to 10, how likely are you to recommend us?" Promoters score 9–10, passives 7–8, detractors 0–6. Subtract the detractor percentage from the promoter percentage. If 60% are promoters and 10% are detractors, your NPS is 50.
If you are a subscription business, read NPS alongside retention data rather than on its own. A promoter who doesn't renew was never really a promoter. Our SaaS retentionb benchmarks give you the context to interpret the number, and our guide to SaaS customer retention strategies covers what to do once you've found the gap.
CES changes the question from "Were you happy?" to "How hard was that?" As most customers remember how hard it was for them to get something more than how satisfied they were, CES is a good predictor of loyalty.
Usually, CES is collected via short surveys that ask, "How easy was it to get your issue handled?" The collected scores are then simply averaged.
CES = average of effort ratings
(typically a 1–7 scale, where lower is better)
Some teams invert the scale so higher is better, but whatever you choose, just stick to one formula.
Low effort is the goal, so aim for an average around 2–3 on a 7-point scale. Since high effort shows up long before churn, CES is a good early sensor in a broader digital customer experience strategy – it flags problems when you can still act on them.
Example: If effort spikes on a particular channel, that's usually a routing or self-service problem rather than an agent problem. The live chat vs chatbot split is a common issue – a bot handling questions that really need a person pushes effort up fast. As such, routing each issue type to the appropriate support channels is usually the fastest way to fix it.
FCR is the operational metric that most closely tracks whether a customer stays or leaves. It measures the share of issues solved on the first interaction.
So what are the “normal” benchmarks? Current data shows:
Yet, only about 5% of contact centers are hitting these goals (Ringly). Not to mention that FCR varies sharply by sector because the more complex the product or service is, the more time is needed to resolve even basic issues. This is exactly why a 65% rate means different things in different industries.
The FCR formula:
FCR = (issues resolved on first contact / total first contacts) × 100
Why should you care if your FCR is high? Well, SQM shows that every 1% improvement in FCR lifts CSAT by roughly 1% and NPS by 1.4 points. Resolution on the first try is also close to a retention guarantee, with 95% of customers continuing to do business when FCR is achieved (SQM).
If you only add one metric this year, add first call resolution, as it’s also a strong prediction of retention and satisfaction. However, be aware that your measurement system may differ if you have AI in the loop. The key difference is that the bot can close a ticket without resolving the issue, which is exactly why AI agent KPIs in customer service track containment and real resolution as separate numbers.
Note: It’s important to track it cleanly, and by each separate channel. That’s why we recommend choosing the help desk software that records repeat contacts, since you can't measure a resolution rate that was never recorded.
{{cta}}
Churn rate measures the percentage of customers who stop doing business with you over a defined period. It’s an especially important metric for companies with a subscription-based model, as the number of stable customers is directly tied to their revenue.
CCR is often used as a proxy for growth and is therefore used to assess whether the company is expanding or losing customers overall over a given period.
Note: Consistently measuring the churn rate can pinpoint potential issues. For instance, if the churn rate spikes after releasing a website redesign, you may want to look into possible correlations between the two.
The formula for CCR is applied like this:
CCR = (lost customers / total customers at the start of the time period) x 100
The output of this formula is a percentage, so the number is multiplied by 100.
Example: Say you begin the quarter with 10,800 subscribers and 700 cancel by the end. Your quarterly churn is 700/10,800×100, or about 6.5%.
The normal churn rate percentage can be defined per month/quarter/year and is heavily dependent on the industry you are in. So, we recommend benchmarking against peers rather than a universal target for a clearer comparison.
Although quite important, the churn rate is a lagging indicator. By the time you see it climb, the customers are probably already leaving.
We recommend that your team keep an eye on CCR, CES, and FCR simultaneously. Plus, modeling risk in advance through customer churn prediction lets you intervene while you still can.
When the question shifts to how to reduce SaaS churn, the answer is often closing support gaps before they widen. Weighed against the revenue each lost account represents, the cost of outsourced customer service usually looks small and presents an alluring solution for a business’s churn issues.
CLV shows what your satisfied customers are actually worth. It's the total revenue you can expect from a relationship over its lifespan, and it turns retention from a soft goal into a budget line.
For a quick calculation, use the formula below:
CLV = average revenue per customer × average customer lifespan × gross margin
A rising customer licfetime value in combination with a stable acquisition cost is one of the clearest signs your satisfaction work is paying off. It also settles internal budget debates: when you know a retained customer is worth several times the cost of keeping them happy, spending on personalized customer service stops looking like a cost center.
That is why we like to say that a good customer service is an investment in your business, because customers who feel known stay longer and spend more.
NRR shows how much revenue you keep and grow from your existing base, ignoring new sales entirely. Leadership likes to track this metric since it clearly captures expansion and contraction in one figure.
You can calculate NRR in the following way:
NRR = (starting MRR + expansion − contraction − churn) / starting MRR × 100
To help you dissect what NRR numbers mean, here’s a quick cheat sheet:
That’s exactly why best-in-class SaaS businesses run at 120% or higher. It's the truest test of whether satisfaction converts to durable revenue: happy customers upgrade, unhappy ones downgrade or leave, and NRR reflects it.
Protect retention and lift NRR as you scale with dedicated SaaS customer support built around the metrics that help you improve.
I now handle a large share of conversations, and that pulls your numbers in two directions at once: it pushes some metrics up while eroding your ability to trust others.
Here are just a few numbers of the impact of AI on customer experience:
One thing to take note of is that CSAT was built for a world where a human handled the conversation, and the customer bothered to rate it. Both assumptions weaken as AI scales.
In fact, Intercom reports that CSAT now captures less than 10% of conversations, skewed toward people angry or delighted enough to respond, which makes the sample unreliable.
Another issue is containment, when a bot doesn’t resolve an issue but simply keeps it from reaching a human. Gladly's 2026 research found that 88% of customers had issues resolved through AI or hybrid interactions, but only 22% said it made them prefer the company. Because a closed issue doesn’t guarantee a won customer.
Not to mention that AI CSAT also runs artificially high on easy questions, scoring several points above human agents, right up until the query gets hard and resolution falls apart.
Since one post-chat score can no longer represent an AI-handled conversation, leading teams are moving to a composite that weights verified outcomes over self-reported feelings. One 2026 framework, composed by Certainly.io but verified by other big players like Fin.ai, Helply, Notch.cx, and Robylon, weights it like this:
We would like two more metrics for this framework:
{{cta}}
The customer satisfaction metrics above only matter if they change how your team operates. The pattern that works is less about the perfect set of metrics and more about a tight loop. Here's how you should actually work with metrics to make them useful.
A loop like this needs well-established customer feedback systems and solid customer service analytics to drive your business growth and improve retention. Because the whole point of collecting data is in identifying a smaller number of trusted signals that you can actually act on.
For years, satisfaction data lived in a quarterly slide that few people acted on between readings. And in 2026, we believe there’s no place for such a habit. Nowadays, companies that win are the ones actively listening to their buyers and meeting their needs.
That’s why our biggest piece of advice is to treat the metrics you track as instruments of change, building them into your weekly decision-making.
That is the line between businesses that hold on to their customers and the ones that learn too late why they left. Good measurement won't rescue a weak product or a stretched team on its own. Without it, though, every other bet you place on customer experience is really just a guess.
And if you want to learn more about how your own business can improve its success, book a meeting with our team. Together, we can dissect which extras your support might need to turn customers into loyal advocates.
Help someone else stay in the know. Hit that share button!







.webp)

.avif)